
Analytics, Good for Business, Industry, Latvia, Markets and Companies
International Internet Magazine. Baltic States news & analytics
Saturday, 20.04.2024, 16:27
In 2015, volume of Latvian industrial production went up by 3.4%
 Print version
As compared to December 2014, in December 2015, industrial production output (according to calendar adjusted data at constant prices) has grown by 2.6%, of which by 3% in manufacturing, by 0.1% in mining and quarrying, and by 1.9% in electricity and gas supply.
Quarterly changes
Compared to the 3rd quarter of 2015, in the 4th quarter of 2015, industrial production output (according to seasonally adjusted data at constant prices) decreased by 1.4%. Of which by 0.7% in manufacturing and by 4.7% in mining and quarrying, whereas in electricity and gas supply there was a growth of 2.4%.
Compared to the corresponding quarter of the year before, in the 4th quarter of 2015, industrial production output (according to calendar adjusted data at constant prices) rose by 3%. Of which by 2.4% in manufacturing, by 5.6% in electricity and gas supply, while in mining and quarrying there was a decrease of 1%.
Annual changes
Compared to 2014, in 2015, volume of industrial production (according to calendar adjusted data at constant prices) went up by 3.4%. The rise was due to the volume growth in manufacturing (of 4.1%), as well as mining and quarrying (of 6.4%), while electricity and gas supply witnessed a drop of 0.1%.
As compared to the year before, in 2015 the greatest production increase in manufacturing was recorded in manufacture of computer, electronic and optical products (of 39.3%), manufacture of furniture (of 13.9%), wood processing (of 6.9%) and manufacture of basic metals.
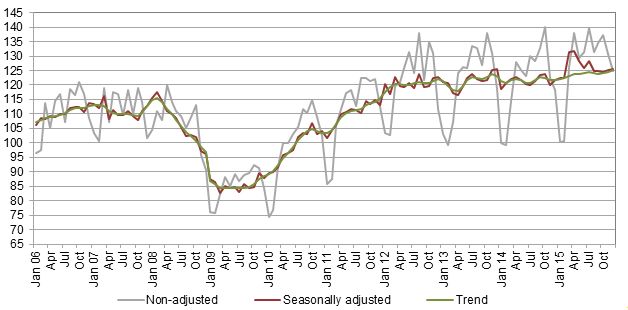 |
| Volume index of manufacturing (2010=100) |
Whereas the most notable production drop in 2015, as compared to 2014, was observed in manufacture of wearing apparel – of 15.6%, in manufacture of other non-metallic mineral products – of 10% and in manufacture of food products – of 5%.
More information on seasonally adjusted, calendar adjusted and non-adjusted industrial production volume indices and weights structure used for the calculations thereof is available in the CSB database section Industry. Data revision conditions are available in the CSB webpage section Metadata – volume indices of industrial production.
Changes in volume of industrial production, %
|
|
2015 compared to 2014 (calendar adjusted) |
4th quarter of 2015 compared to |
December 2015 compared to |
||
|
3rd quarter of 2015 (seasonally adjusted) |
4th quarter of 2014 (calendar adjusted) |
November 2015 (seasonally adjusted) |
December 2014 (calendar adjusted) |
||
|
Total production |
3.4 |
-1.4 |
3.0 |
-1.2 |
2.6 |
|
Mining and quarrying |
6.4 |
-4.7 |
-1.0 |
3.7 |
0.1 |
|
Manufacturing |
4.1 |
-0.7 |
2.4 |
0.1 |
3.0 |
|
Manufacture of food products |
-5.0 |
-4.6 |
-5.5 |
1.1 |
-1.8 |
|
Manufacture of textiles |
-5.8 |
-5.4 |
1.7 |
-8.0 |
-1.6 |
|
Manufacture of wearing apparel |
-15.6 |
0.7 |
-10.7 |
-1.2 |
5.0 |
|
Manufacture of wood and cork articles, except furniture |
6.9 |
4.0 |
8.7 |
5.1 |
13.9 |
|
Manufacture of chemicals and chemical products |
3.5 |
15.0 |
5.7 |
-2.5 |
-0.4 |
|
Manufacture of non-metallic mineral products |
-10.0 |
-4.9 |
-14.9 |
-9.0 |
-24.3 |
|
Manufacture of fabricated metal products, except machinery and equipment |
-3.8 |
1.1 |
-2.4 |
-5.3 |
-5.8 |
|
Manufacture of computer, electronic and optical products |
39.3 |
7.4 |
29.8 |
4.2 |
25.3 |
|
Manufacture of electrical equipment |
-5.5 |
-2.9 |
-9.0 |
18.6 |
3.4 |
|
Manufacture of motor vehicles, trailers and semi-trailers |
-1.0 |
-5.3 |
-11.0 |
1.3 |
-3.0 |
|
Manufacture of furniture |
13.9 |
-1.8 |
10.4 |
-4.2 |
12.1 |
|
Repair and installation of machinery and equipment (repair and maintenance of ships and boats, repair of fabricated metal products, machinery and equipment, installation of industrial machinery and equipment) |
-1.8 |
-7.2 |
-0.8 |
0.6 |
-3.4 |
|
Electricity and gas supply |
-0.1 |
2.4 |
5.6 |
-3.6 |
1.9 |


 «The Baltic Course» Is Sold and Stays in Business!
