
Analytics, Good for Business, Industry, Lithuania, Markets and Companies
International Internet Magazine. Baltic States news & analytics
Thursday, 18.04.2024, 14:30
In January–October, industrial production in Lithuania grew by 4.7%
 Print version
Over the month, mining and quarrying and manufacturing production increased by 9.3%, seasonally and working day adjusted – by 11.1%; manufacturing production increased by 9.2%, seasonally and working day adjusted – by 11.1%.
Over the month, an increase in production was observed for the electricity, gas, steam and air conditioning supply (49.1%), repair and installation of machinery and equipment (28.5%), manufacture of refined petroleum products (22.4%), computer, electronic and optical products (14.9%), textiles (12.6%), food products (11.2%).
In October 2015, against September, a decrease in production was observed for the manufacture of other transport equipment (19.8%), beverages (6%), motor vehicles, trailers and semi-trailers (5.1%), basic pharmaceutical products and pharmaceutical preparations (3.3%), rubber and plastic products (1.2%).
Table 1. Changes in industrial production, at constant prices of 2010, growth, drop, (−),%
|
Economic activities |
October 2015, against |
||||
|
September |
August, seasonally and working day adjusted |
October 2014 |
October 2014, working day adjusted |
2010 monthly average |
|
|
Industry (B–E) |
11.7 |
11.3 |
5.1 |
6.5 |
31.2 |
|
Mining and quarrying, manufacturing (B and C) |
9.3 |
11.1 |
4.8 |
6.4 |
42.9 |
|
Mining and quarrying (B) |
9.7 |
9.7 |
−11.5 |
−8.7 |
32.0 |
|
Manufacturing (C) |
9.2 |
11.1 |
4.9 |
6.6 |
43.0 |
|
Manufacturing (except for the manufacture of refined petroleum products) (C excl. C19) |
5.4 |
2.6 |
4.1 |
6.3 |
59.7 |
|
Electricity, gas, steam and air conditioning supply (D) |
49.1 |
13.1 |
9.5 |
7.3 |
−31.1 |
|
Water supply, sewerage, waste management and remediation activities (only Division 36 of Section E – water collection, treatment and supply) |
−1.7 |
−0.6 |
1.1 |
2.2 |
3.8 |
|
Main industrial groupings |
|||||
|
Energy products |
28.0 |
24.5 |
7.9 |
7.2 |
−5.9 |
|
Intermediate goods |
2.4 |
0.7 |
1.0 |
3.7 |
50.6 |
|
Capital goods |
6.8 |
−0.8 |
4.1 |
2.6 |
76.8 |
|
Consumer durables |
5.4 |
1.1 |
11.4 |
12.8 |
2.2 t. |
|
Consumer non-durables |
9.3 |
5.3 |
4.9 |
7.2 |
49.4 |
In October 2015, against October 2014, industrial production increased by 5.1% at constant prices, working day adjusted – increased by 6.5%. Over the year, mining and quarrying and manufacturing production increased by 4.8%, working day adjusted – by 6.4%, of which manufacturing production increased by 4.9%, working day adjusted – by 6.6%.
In January–October 2015, industrial production totalled EUR 15.6 billion at current prices and compared to the same period of 2014, grew by 4.7% at constant prices, working day adjusted – by 4.4%. Over the said period, mining and quarrying and manufacturing production increased by 5.5%, working day adjusted – by 5.1%; of which manufacturing production increased by 5.7%, working day adjusted – by 5.4%.
Table 2. Changes in industrial production, at constant prices of 2010, growth, drop, (−), %
|
Economic activities |
January–October 2015, against |
|
|
January–October 2014 |
January–October 2014, working day adjusted |
|
|
Industry (B–E) |
4.7 |
4.4 |
|
Mining and quarrying, manufacturing (B and C) |
5.5 |
5.1 |
|
Mining and quarrying (B) |
−16.5 |
−15.8 |
|
Manufacturing (C) |
5.7 |
5.4 |
|
Manufacturing (except for the manufacture of refined petroleum products) (C excl. C19) |
4.6 |
4.7 |
|
Electricity, gas, steam and air conditioning supply (D) |
−2.6 |
−2.7 |
|
Water supply, sewerage, waste management and remediation activities (only Division 36 of Section E – water collection, treatment and supply) |
−0.3 |
−0.1 |
|
Main industrial groupings |
||
|
Energy products |
5.6 |
4.0 |
|
Intermediate goods |
3.3 |
3.5 |
|
Capital goods |
2.2 |
1.9 |
|
Consumer durables |
13.6 |
13.4 |
|
Consumer non-durables |
3.1 |
3.5 |
In January–October 2015, against January–October 2014, the proportion of mining and quarrying and manufacturing sales and services on the non-Lithuanian market increased by 0.8%age points and stood at 64.2%, on the Lithuanian market – decreased by 0.8 percentage points and stood at 35.8%. The value of sales and services to non-euro area countries accounted for more than half (52.1%) of the total value of sales and services on the non-Lithuanian market.
In January–October2015, against January–October 2014, the value of sales and services of industrial enterprises on the non-Lithuanian market decreased by 1.5% at current prices. The decrease was mainly influenced by a 14.9% drop in the sales of the production of enterprises engaged in the manufacture of refined petroleum products, 9.7% – food products, 8.1% – rubber and plastic products. Over the said period, an increase in sales on the non-Lithuanian market was observed for the production of the manufacture of furniture (16.8%), wood and wood products, except for furniture (13.3%), chemicals and chemical products (4.7%), fabricated metal products, except machinery and equipment (18.1%).
Refined petroleum products excluded, the value of sales and services on the non-Lithuanian market increased by 3.9% at current prices. The value of sales and services to euro area countries decreased by 6%, while to non-euro area countries – increased by 2.7% at current prices.
In January–October 2015, against January–October 2014, the value of sales and services of mining and quarrying and manufacturing on the Lithuanian market decreased by 4.4% at current prices, refined petroleum products excluded – by 0.5% at current prices.
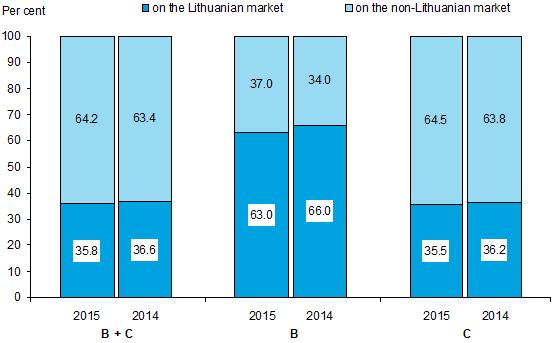 |
| Structure of sales and services market of mining and quarrying and manufacturing enterprises, January–October 2015 |
Mining and quarrying – B
Manufacturing – C
Concepts
Sales and services of industrial enterprises refers to income (VAT and excise excluded) received during a reference period through selling goods and providing services.
Industrial production refers to the value (VAT and excise excluded) of the sales of goods manufactured or manufacturing work carried out by an enterprise. For the calculation of changes in industrial production, a producer price index is used.
For more information, see the Database of Indicators.


 «The Baltic Course» Is Sold and Stays in Business!
