
Analytics, Good for Business, Industry, Latvia, Markets and Companies
International Internet Magazine. Baltic States news & analytics
Friday, 26.04.2024, 01:20
In February, industrial production in Latvia witnessed 1.5% growth
 Print version
Production output in manufacturing grew by 0.7%, in mining and quarrying – by 1.5%, and in electricity and gas supply – by 6.3%.
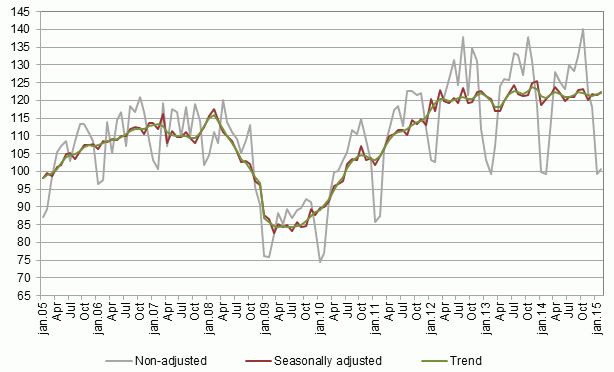 |
| Volume index of manufacturing (2010=100) |
Data source: Central Statistical Bureau of Latvia
Compared to February 2014, industrial production output decreased by 1.6%, according to calendar adjusted data at constant prices. It was affected by production drop of 11.5% in electricity and gas supply. In turn, in manufacturing industrial production witnessed a growth of 1.6% and in mining and quarrying – of 6.7%.
Production growth was observed in manufacture of computer, electronic and optical products – of 98.9%, in manufacture of furniture – of 20.2%, in manufacture of wood and cork articles – of 9.7%, and in manufacture of fabricated metal products, except machinery and equipment – of 3.9%.
In turn production drop was observed in manufacture of textiles – of 23.4%, in manufacture of wearing apparel – of 22.4% and in manufacture of food products – of 10.7%.
Changes in volume of industrial production, % (at constant prices)
|
|
January – February 2015 compared to January – February 2014 |
February 2015 compared to |
|
|
January 2015 (seasonally adjusted) |
February 2014 |
||
|
All production |
-2.6 |
1.5 |
-1.6 |
|
Mining and quarrying |
10.8 |
1.5 |
6.7 |
|
Manufacturing |
1.8 |
0.7 |
1.6 |
|
Manufacture of food products |
-7.2 |
-3.1 |
-10.7 |
|
Manufacturing of textiles |
-24.9 |
-4.2 |
-23.4 |
|
Manufacture of wearing apparel |
-15.5 |
-12.8 |
-22.4 |
|
Manufacture of wood and cork articles, except furniture |
9.8 |
2.7 |
9.7 |
|
Manufacture of chemicals and chemical products |
-2.9 |
4.7 |
3.3 |
|
Manufacture of non-metallic mineral products |
0.9 |
2.5 |
-1.2 |
|
Manufacture of fabricated metal products, except machinery and equipment |
1.8 |
-2.2 |
3.9 |
|
Manufacture of computer, electronic and optical products |
116.7 |
-8.0 |
98.9 |
|
Manufacture of electrical equipment |
-14.6 |
1.9 |
-16.2 |
|
Manufacture of machinery and equipment |
-3.4 |
-8.9 |
-8.3 |
|
Manufacture of motor vehicles, trailers and semi-trailers |
-1.1 |
1.2 |
0.7 |
|
Manufacture of furniture |
16.4 |
5.6 |
20.2 |
|
Repair and installation of machinery and equipment (repair and maintenance of ships and boats, repair of fabricated metal products, machinery and equipment, installation of industrial machinery and equipment) |
-4.9 |
1.1 |
-0.8 |
|
Electricity and gas supply |
-15.6 |
6.3 |
-11.5 |
More information on seasonally adjusted, calendar adjusted and non-adjusted industrial production volume indices and weights structure used in the calculations is available in the CSB database section Industry.


 «The Baltic Course» Is Sold and Stays in Business!
