
Analytics, Good for Business, Latvia, Markets and Companies, Retail
International Internet Magazine. Baltic States news & analytics
Wednesday, 24.04.2024, 12:33
In 2014, Latvia’s retail trade turnover rose by 3.6%
 Print version
Compared with November, the total retail trade turnover in December 2014 reduced by 1.3%, according to seasonally adjusted data. Retail trade in food products rose by 0.6%, whereas turnover of non-food products dropped by 2.5%.
Compared to November, the total retail trade turnover at current prices, not taking into account seasonality, in December increased by 14.2%. A year ago – in December 2013, compared to November 2013 – turnover increased by 16.9%.
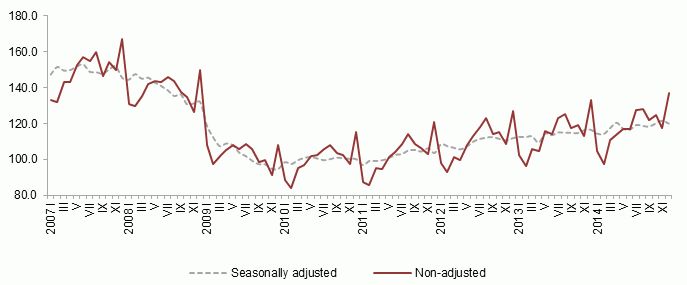 |
| Retail trade turnover indices (as % over average monthly turnover of 2010, at constant prices) |
Data source: Central Statistical Bureau of Latvia
Compared to December 2013, the total retail trade turnover in December 2014 grew by 2.7%, according to calendar adjusted data at constant prices. Rise in food commodity group comprised 0.4%. In non-food commodity group there was a 4.2% increase, of which in retail sale of automotive fuel – 10.9%.
Compared to December 2013 the total retail trade turnover at current prices rose by 0.8% in December 2014 (not taking into account the calendar influence).
|
| Changes in turnover of retail trade enterprises (as % of corresponding month of previous year, at constant prices, according to calendar adjusted data) |
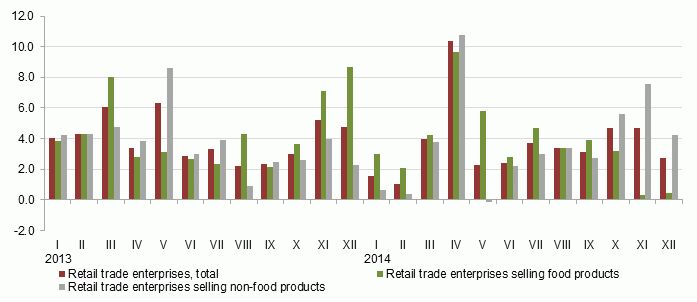
Data source: Central Statistical Bureau of Latvia
Turnover indices of retail trade enterprises by main kind of economic activity (at constant prices)
|
|
2014 (%) over 2013 (calendar adjusted) |
December 2014 (%) over |
|||
|
November 2014 (seasonally adjusted) |
December 2013 (calendar adjusted) |
||||
|
Retail trade – total |
103.6 |
98.7 |
102.7 |
||
|
|
retail sale of food products, total |
103.6 |
100.6 |
100.4 |
|
|
|
retail sale of non-food products, total |
103.7 |
97.5 |
104.2 |
|
|
|
|
retail sale in non-specialised stores selling mainly non-food products |
91.7 |
100.7 |
90.1 |
|
|
|
retail sale of pharmaceutical and medical goods |
99.7 |
98.1 |
99.6 |
|
|
|
retail sale of textiles, clothing, footwear and leather goods |
111.8 |
96.3 |
104.9 |
|
|
|
retail sale of hardware, paints and glass |
102.1 |
102.2 |
102.2 |
|
|
|
retail sale of furniture, lighting equipment and other household articles in specialised stores |
105.4 |
97.8 |
102.5 |
|
|
|
retail sale of automotive fuel |
106.1 |
95.2 |
110.9 |
|
Sale of motor vehicles and motorcycles |
103.6 |
97.4 |
102.4 |
||
More information on seasonally adjusted, calendar adjusted and non-adjusted retail trade turnover indices is available in the CSB database.


 «The Baltic Course» Is Sold and Stays in Business!
