
Analytics, Banks, Direct Speech, Economics, Financial Services, Inflation, Latvia
International Internet Magazine. Baltic States news & analytics
Tuesday, 16.04.2024, 20:25
Why inflation rate of close to 3% is healthy for Latvia at this stage
 Print version
 |
|---|
First, the inflation observed in Latvia is the price we are paying for income growth. Prices in the rich countries are higher than in the poor ones, in particular prices of non-tradable goods such as a cup of coffee, hairdresser's services or a ride in a taxi. A close positive correlation between the income level and prices also exists in the European Union (EU) countries (Chart 1). In all countries where the increase in income is higher than the EU average, a faster price rise has also been observed. Latvia is one of such cases.
Chart 1. Income and price levels in 2017
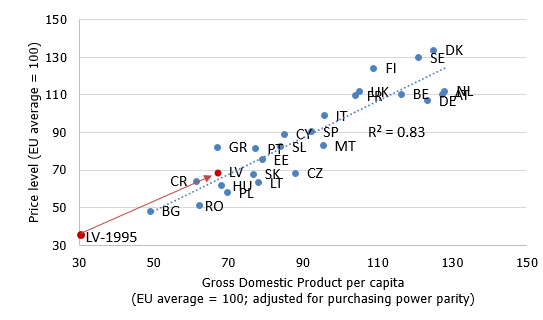
Note. Luxembourg and Ireland are excluded as they are outliers, i.e. the values of their indicators are considerably different.
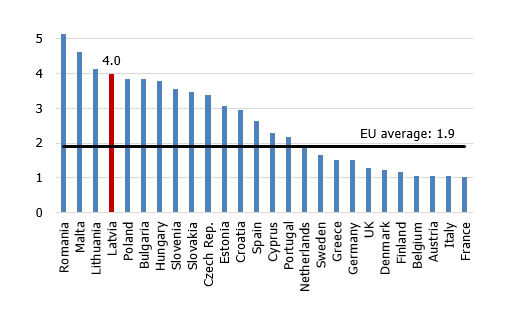
All forecasts suggest that in the coming years the Latvian economy will also grow faster than the EU average (Chart 2). That will allow us to further reduce the income gap between Latvia and Western Europe. However, it is not possible to reach the level of German well-being with Romanian price level; along with an increase in income, prices will also rise.
Chart 2. GDP growth per capita in 2014–2019 (%)
Second, inflation in Latvia is also slightly higher on account of business cycle expansion. At this stage, the Latvian economy is functioning close to its potential or even slightly above it. Unemployment has shrunk below its natural level and the insufficient amount of investment observed in the previous years now manifests itself in high production capacity utilisation. Businesses face difficulties in filling the job vacancies; that makes them raise remuneration at a pace faster than that of labour productivity growth; consequently, production costs are on the rise and find reflection in higher prices. Other euro area countries where the economy functions close to its potential or even slightly above it, also have a slightly higher inflation than the countries where the economy is functioning considerably below its potential (Charts 3 and 4).
Chart 3. Core inflation and output gap
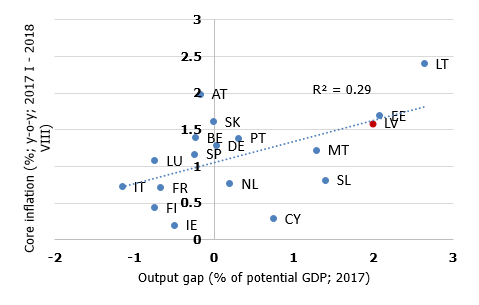
Core inflation is inflation excluding taxes, energy and food.
The country sample covers euro area countries. Greece is excluded as it is an outlier.
Chart 4. Core inflation and the cyclical unemployment component
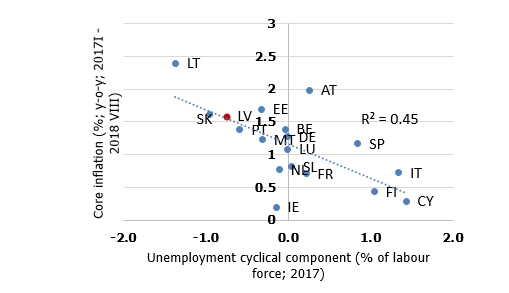
Core inflation is inflation excluding taxes, energy and food.
The country sample covers euro area countries. Greece is excluded as it is an outlier.
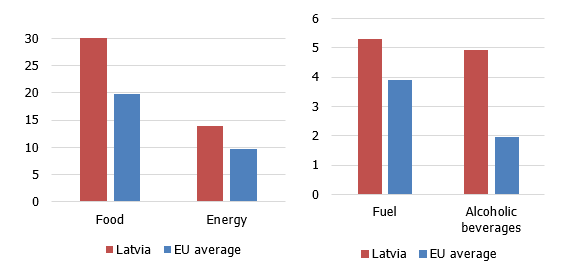
Third, cross-country inflationary differences are partly a result of the country-specific features of the consumption basket. For example, Latvia is characterised by quite a large share of energy-related goods in the consumption basket: our overall spending on fuel, heat, electricity and natural gas makes up a considerably higher percentage of expenses than in most other countries (Chart 5). Therefore, the rise in oil prices (currently 85 USD per barrel, up from 50 USD per barrel in mid-2017) will have a more pronounced effect on inflation in Latvia than in some other EU countries.
Food is another component that accounts for a relatively large part of our spending. That is why the global price rise on dairy products, observed in the first half of 2017, had a relatively strong impact on inflation in Latvia. Moreover, quite a large portion in our consumption basket is occupied by products with a regularly reviewed and raised excise tax rate: fuel and alcoholic beverages (Chart 5). Thus, a similar increase in the excise tax rate on alcoholic beverages (e.g. 10% in all EU countries) may raise inflation in Latvia twice as high as the EU average.
Chart 5. Share of selected goods and services in the consumption basket (%)
Conclusion: the fact that inflation in Latvia last year and this year has slightly exceeded the euro area average results from a combination of long-term (1), medium-term (2) and short-term (3) factors. It is not possible to reach the German well-being with Romanian prices; an increase in price levels is an adequate price we pay for a higher standard of living. The currently observed cyclical expansion, rise in oil prices and regular raising of excise tax rate also contribute to inflation. Hence, the annual inflation of close to 3%, currently observed in Latvia, is a sign of healthy economy reflecting income convergence and cyclical expansion.


 «The Baltic Course» Is Sold and Stays in Business!