
Analytics, Economics, Estonia, Export, GDP, Markets and Companies
International Internet Magazine. Baltic States news & analytics
Thursday, 25.04.2024, 19:56
Estonian economy grew by 2.2% in Q3
 Print version
In the 3rd quarter, the GDP at current prices was 4.9 billion euros.
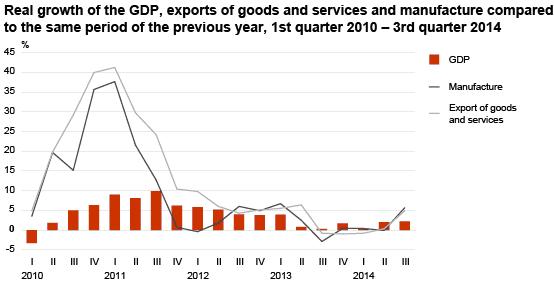
In the 3rd quarter, the seasonally and working-day adjusted GDP increased by 0.4% compared to the 2nd quarter of 2014 and 2.3% compared to the 3rd quarter of 2013.
In the 3rd quarter of 2014, the GDP growth was influenced the most by a rise in the value added in manufacture and trade. The GDP growth was also positively influenced by increased receipts of value added tax, which is a part of net taxes on products. The value added in construction slowed the Estonian economy down the most, mainly due to decreased construction volumes. In addition, the GDP growth was substantially decelerated by a decrease in transportation and real estate activities.
The export of goods and services decreased 5% and import 2% at real prices. The increase in the export of goods was influenced the most by a rise in the export of electronic products, other machinery and equipment n.e.c. and chemical products. The import of goods and services was greatly influenced by an increase in the import of electronic and chemical products and electrical equipment. Net export (e.g. the difference between export and import) amounted to 3.8% of the GDP in the 3rd quarter of 2014.
In the 3rd quarter, real GDP grew faster than the number of persons employed and hours worked. Therefore the total economy’s labour productivity per employee and per hours worked increased 1% compared to the same quarter of the previous year. Labour productivity is calculated based on seasonally and calendar adjusted figures. At the same time, labour costs for GDP production have increased. In the 3rd quarter, unit labour costs increased 7% compared to the same quarter of the previous year. This indicates that compensation per employee has grown faster than productivity.
The growth of domestic demand slowed down to 3%, accounting for 98.3% of the GDP. The gross fixed capital formation decreased 10% in real terms. It was mainly caused by a decrease in the investments of the business and government sector in buildings and structures, and other machinery and equipment. The previous time that the gross fixed capital formation decreased in real terms was in the 1st quarter of 2013. The increase of domestic demand was supported by the growth of the household final consumption expenditures and inventories. Household final consumption expenditures grew 5% mainly due to an increase in expenditure on food and non-alcoholic beverages and transport. Just like in the previous quarter, the growth of inventories was supported the most by an increase in the inventories of goods.
On 8 September 2014, Statistics Estonia published the national accounts time series for the first time based on the new methodology – ESA 2010. An analysis revealed that there were some differences between Eesti Pank’s (central bank of Estonia) balance of payments statistics and Statistics Estonia’s national accounts statistics on the exports and imports of goods and services. Acting in close cooperation, Eesti Pank and Statistics Estonia have harmonised the data sources and methodology, and revised the time series of the exports and imports of goods and services since 2010.
Due to an adjustment in the 2010, 1st and 2nd quarter of 2014 imports of financial intermediation services indirectly measured (FISIM), the distribution of intermediate consumption between all sectors (excl. non-profit institutions) will change as well.
Net export at current prices, 2010–2013 (million euros)
|
|
2010 |
2011 |
2012 |
2013 |
|
Before revision |
931.5 |
591.9 |
16.4 |
162.3 |
|
After revision |
935.6 |
954.6 |
176.0 |
270.7 |
|
Difference |
4.0 |
362.7 |
159.6 |
108.5 |


 «The Baltic Course» Is Sold and Stays in Business!
