
Analytics, Baltic Export, Baltic States – CIS, EU – Baltic States, Foreign trade , Latvia
International Internet Magazine. Baltic States news & analytics
Thursday, 25.04.2024, 06:18
In September, exports value of goods grew by 12.7%, but imports value – by 15.2% in Latvia
 Print version
In September Latvia exported goods in amount of 914.0 mln euros, but imported – in amount of 1,138.2 mln euros. Foreign trade balance slightly worsened as exports in total foreign trade value declined to 44.5% (in August 2014 – 45.1%).
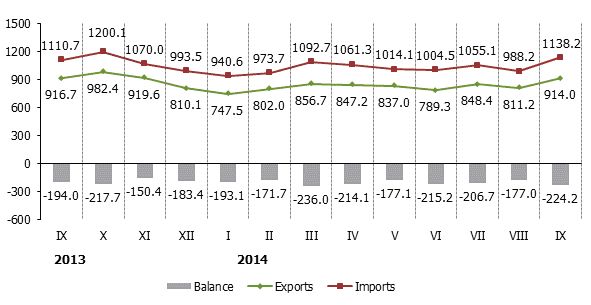 |
| Latvia’s foreign trade, in mln euros (1) |
Data source: Central Statistical Bureau of Latvia
In September export of vegetable products, compared to August, under the influence of seasonality increased by 37.7 mln euros or 2.4 times. Export of vegetable products was mostly impacted by rise of export of wheat and meslin, and brans – by 32.9 mln euros or 10.7 times. In September it was mostly exported to Iran – 13.5 mln euros, Spain - 8.0 mln euros, Turkey - 6.5 mln euros and Denmark – 2.7 mln euros.
Main changes in exports in September, compared to August:
- exports of prepared foodstuffs rose by 18.3 mln euros or 22.4%,
- exports of products of the chemical and allied industries grew by 11.2 mln euros or 19.9%,
- exports of mineral products increased by 10.4 mln euros or 13.9%,
- exports of basic metals and articles of basic metals reduced by 3.1 mln euros or 3.9%.
Main changes in imports in September, compared to August:
- imports of vehicles and associated transport equipment increased by 26.9 mln euros or 54.4%,
- imports of machinery and mechanical appliances; electrical equipment grew by 25.3 mln euros or 12.8%,
- imports of mineral products rose by 18.7 mln euros or 12.6%,
- imports of products of the chemical and allied industries grew by 14.2 mln euros or 15.4%,
- imports of textiles and textile articles increased by 10.7 mln euros or 20.8%.
Foreign trade of Latvia by country group in September 2014, at current prices
|
|
Exports |
Imports |
||||
|
|
mln euros |
% of total |
In % (+, -) over August 2014 |
mln euros |
% of total |
In % (+, -) over August 2014 |
|
Total |
914.0 |
100 |
+12.7 |
1,138.2 |
100 |
+15.2 |
|
Member States of the European Union |
644.7 |
70.5 |
+9.8 |
920.5 |
80.9 |
+16.6 |
|
Euro area countries |
270.9 |
29.6 |
+14.6 |
464.3 |
40.8 |
+17.8 |
|
CIS countries |
154.8 |
16.9 |
+17.6 |
118.4 |
10.4 |
+7.9 |
|
Other countries |
114.6 |
12.6 |
+24.2 |
99.3 |
8.7 |
+11.4 |
In September main export partners were Lithuania (19.4% of total export), Estonia (11.8%), Germany (6.5%) and Poland (5.2%), but main import partners were Lithuania (18.5% of total import), Germany (10.8%), Poland (10.6%) and Finland (7.3%).
Main partner in trade with third countries was Russia, share of which in total exports of Latvia in September comprised 12.4%, but in imports – 7.5%.
Changes of main commodities in Latvia’s exports in September 2014, at current prices
|
|
thsd euros |
% of total |
% (+, -) over |
||
|
September 2013 |
August 2014 |
average of previous 12 months |
|||
|
Total |
914,047 |
100 |
-0.3 |
+12.7 |
+7.9 |
|
wood and wood products; wood charcoal |
146,852 |
16.1 |
+2.9 |
+2.9 |
+2.3 |
|
electrical machinery and equipment |
89,773 |
9.8 |
+5.6 |
-2.7 |
-0.4 |
|
mineral fuels, mineral oils and products of their distillation |
79,561 |
8.7 |
-14.7 |
+15.1 |
+19.8 |
|
beverages, spirits and vinegar |
61,856 |
6.8 |
+35.1 |
+30.4 |
+50.7 |
|
machinery and mechanical appliances |
50,392 |
5.5 |
+18.5 |
+16.9 |
+16.9 |
|
cereals |
42,327 |
4.6 |
-6.4 |
+6.8 times |
+69.6 |
|
articles of iron and steel |
31,808 |
3.5 |
-0.04 |
+7.1 |
+10.6 |
|
pharmaceutical products |
31,727 |
3.5 |
+17.3 |
+28.3 |
+16.3 |
|
vehicles other than railway or tramway |
30,529 |
3.3 |
+1.8 |
+13.0 |
-6.7 |
|
iron and steel |
25,307 |
2.8 |
-37.9 |
-17.2 |
-23.9 |
Rise of exports of alcoholic and non-alcoholic beverages in September 2014, as compared to September 2013, was affected by the increase in exports of spirits by 11.8 mln euros or 32.6%. In turn, exports of iron and steel dropped as exports of waste and scrap of cast iron decreased by 12.7 mln euros or 66.9%.
Changes of main commodities in Latvia’s imports in September 2014, at current prices
|
|
thsd euros |
% of total |
% (+, -) over |
||
|
September 2013 |
August 2014 |
average of previous 12 months |
|||
|
Total |
1 138 150 |
100 |
+2.5 |
+15.2 |
+9.2 |
|
mineral fuels, mineral oils and products of their distillation |
160,844 |
14.1 |
-17.2 |
+12.5 |
+4.4 |
|
electrical machinery and equipment |
131,555 |
11.6 |
+13.9 |
+14.8 |
+22.8 |
|
machinery and mechanical appliances |
92,084 |
8.1 |
+4.6 |
+10.0 |
+3.3 |
|
vehicles other than railway or tramway |
62,716 |
5.5 |
-10.5 |
+45.3 |
-9.3 |
|
plastics and articles thereof |
47,040 |
4.1 |
+12.3 |
+15.1 |
+12.3 |
|
pharmaceutical products |
44,672 |
3.9 |
+11.3 |
+13.1 |
+3.7 |
|
iron and steel |
44,017 |
3.9 |
+22.7 |
+8.1 |
+13.6 |
|
articles of iron and steel |
30,520 |
2.7 |
-6.6 |
+24.4 |
+10.0 |
Rise of imports of iron and steel in September 2014, as compared to September 2013, was mostly affected by the increase in imports of flat rolled products of iron and non-alloy steel of 4.7 mln euros or 27.9%. In its turn, reduction of imports of mineral fuels, mineral oils and products of their distillation was influenced by decrease of imports of diesel oil by 15.5 mln euros or 13.6%.
More information on Latvia’s foreign trade by month and quarter, by country group and commodity group is available in the CSB data base section "Foreign trade" Short term statistical data.
1 Data on June 2014 have been revised.


 «The Baltic Course» Is Sold and Stays in Business!
