
Analytics, Economics, GDP, Lithuania, Markets and Companies
International Internet Magazine. Baltic States news & analytics
Saturday, 20.04.2024, 00:16
In Q3, GDP in Lithuania increased by 0.4%
 Print version
In III quarter 2014, the growth in GDP was mainly conditioned by the reviving construction sector, transportation and storage, as well as accommodation and food service activities.
Over 3 quarters of 2014, GDP amounted to LTL 93506.5 million (EUR 27081.4 million), and against the respective period of 2013, it increased by 3.1%, seasonally and working day adjusted (seasonally and working day unadjusted, GDP increased by 3.1%).
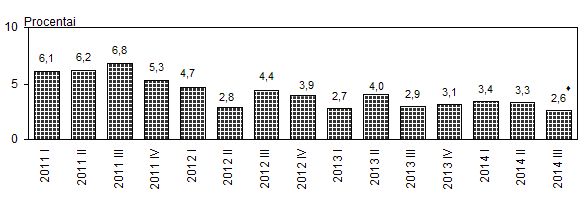 |
| Fig. 1. Changes in gross domestic product, compared to the same period of the previous year, seasonally and working day adjusted |
♦ GDP change first estimate
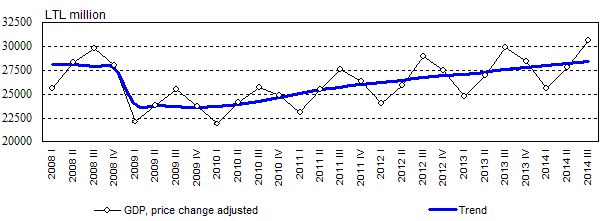 |
| Fig. 2. Changes in gross domestic product |
Statistics Lithuania, based on more detailed data and having estimated the value added according to the methodological provisions of the ESA 2010, revised the GDP estimates for I and II quarters of 2014. According to the revised data, in I quarter 2014, GDP amounted to LTL 28051 million (EUR 8124 million), in II quarter 2014 – LTL 31678 million (EUR 9175 million) at current prices; against the same quarter of 2013, it grew by 3.4 and 3.3% respectively.
------------------------
1GDP changes were seasonally and working day adjusted.
Table 1. Gross domestic product and its changes
|
|
At current prices |
GDP changes, % |
||||
|
LTL million |
EUR million |
compared to the previous period |
compared to the same period of the previous year |
seasonally and working day adjusted |
||
|
compared to the previous period |
compared to the same period of the previous year |
|||||
|
2010 |
96 682.9 |
28 001.3 |
1.6 |
1.6 |
1.7 |
1.7 |
|
I |
21 687.1 |
6 281.0 |
–7.8 |
–1.0 |
0.9 |
–1.1 |
|
II |
24 569.8 |
7 155.9 |
10.5 |
1.2 |
1.6 |
1.6 |
|
III |
25 299.7 |
7 327.3 |
6.7 |
0.9 |
0.0 |
1.0 |
|
IV |
25 126.2 |
7 277.0 |
–3.2 |
5.1 |
2.5 |
5.1 |
|
2011 |
107 890.6 |
31 247.3 |
6.1 |
6.1 |
6.1 |
6.1 |
|
I |
23 841.6 |
6 905.0 |
–7.1 |
6.0 |
1.9 |
6.1 |
|
II |
27 520.1 |
7 970.4 |
10.0 |
5.5 |
1.7 |
6.2 |
|
III |
28 796.7 |
8 340.1 |
8.3 |
7.1 |
0.6 |
6.8 |
|
IV |
27 732.2 |
8 031.8 |
–4.5 |
5.7 |
1.1 |
5.3 |
|
2012 |
115 026.5 |
33 314.0 |
3.8 |
3.8 |
3.9 |
3.9 |
|
I |
25 828.5 |
7 480.5 |
–8.7 |
3.9 |
1.3 |
4.7 |
|
II |
28 716.7 |
8 316.9 |
8.0 |
2.0 |
–0.2 |
2.8 |
|
III |
30 875.6 |
8 942.2 |
11.7 |
5.1 |
2.1 |
4.4 |
|
IV |
29 605.6 |
8 574.4 |
–5.2 |
4.3 |
0.6 |
3.9 |
|
2013◘ |
120 694.7 |
34 955.6 |
3.3 |
3.3 |
3.2 |
3.2 |
|
I |
26 754.5 |
7 748.6 |
–9.8 |
3.1 |
0.1 |
2.7 |
|
II |
30 541.1 |
8 845.3 |
8.7 |
3.7 |
1.1 |
4.0 |
|
III |
32 319.8 |
9 360.5 |
10.8 |
3.0 |
1.1 |
2.9 |
|
IV |
31 079.2 |
9 001.2 |
–4.9 |
3.3 |
0.8 |
3.1 |
|
2014 |
|
|
|
|
|
|
|
I* |
28 051.6 |
8 124.3 |
–9.8 |
3.3 |
0.4 |
3.4 |
|
II* |
31 678.0 |
9 174.6 |
8.8 |
3.4 |
0.9 |
3.3 |
|
III♦ |
33 777.0 |
9 782. 5 |
10.1 |
2.7 |
0.4 |
2.6 |
♦ First
estimate * Provisional data ◘ Non-final data
Real GDP changes have been estimated using a chain-linking method, which enables the elimination of the influence of price changes.
In order to ensure comparability across the countries, data on GDP changes published by Eurostat are seasonally and working day adjusted.
In September 2014, revised methodological provisions of the European System of National and Regional Accounts (ESA 2010 instead of ESA 1995) came into force, on the basis of which national accounts aggregates must be now produced and published. The time series of the main national accounts aggregates were revised from 2005; in 2015, earlier periods' time series will also be revised and published.
More information on the issue is available in the Database of Indicators.


 «The Baltic Course» Is Sold and Stays in Business!
