
Analytics, Inflation, Lithuania, Markets and Companies
International Internet Magazine. Baltic States news & analytics
Friday, 19.04.2024, 22:27
In September, annual deflation 0.1% registered in Lithuania
 Print version
It was mainly influenced by an increase in prices for clothing, vegetables, footwear, other non-electric appliances, articles and products for personal care, tobacco products, services of restaurants, cafes and similar establishments and a decrease in prices for passenger transport by air services, heat energy, solid fuel, package holidays, beer and spirits (see Table 2).
Over the said period, prices for consumer goods grew by 0.6, for consumer services – dropped by 0.1% (which was influenced by a decrease in prices for seasonal services).
Prices for consumer goods and services regulated by State and municipal authorities decreased by 0.5, while market prices grew by 0.6%. The influence of the change in prices regulated by State and municipal authorities was negative and stood at minus 0.1 percentage points, while the influence of market prices was positive and stood at plus 0.15 percentage points.
In September 2014, against August, due to the appearance of new autumn collections, prices for footwear increased by 7, clothing – 5.1, other clothing articles and accessories – 0.9%. Prices for footwear repair services went up by 1.6%, while clothing rental services went down in price by 2.7%.
Out of food products and non-alcoholic beverages, the largest increase in prices – 11.5% – was observed for vegetables. Out of fruit and berries, the largest increase in prices was observed for lemons – by 14.5, oranges – 8, grapefruits – 6.7, and bananas – 2.7%; a decrease in prices was observed for grapes – by 24.6, pears – 18.5, and apples – 8.8%. An increase in prices was also observed for nuts – by 4.1, coffee – 2, bread – 1, smoked sausages, smoked fish, preserved fish, baby food – 0.9% each, and sour cream – 0.5%; a decrease in prices was observed for sugar – by 3.5, flour – 1.6, rice – 1.5, groats – 1.3, fruit and vegetable juices – 1.2, and curd – 1%.
As for housing, water, electricity, gas and other fuels goods and services, the largest decrease in prices was observed for heat energy – by 3, solid fuel – 2.3, and housing maintenance and repair products and materials – 1.7%. Housing rental went up in price by 1.9, housing maintenance and repair services – by 0.8%.
Out of transport goods and services, the largest decrease in prices was observed for passenger transport by air services – by 14.9%. Price for liquefied gas for cars decreased by 4.4%, while prices for diesel fuel increased by 0.5, petrol – 0.2%.
In the group of miscellaneous services, the largest decrease in prices was observed for sanatorium services – by 5.7, package holidays – 4.3, Internet access services – 1.7, accommodation services – 0.9%; an increase in prices was observed for furniture repair services – by 1.9, audio‑visual and information processing equipment repair services – 1.8, household equipment repair services – 1.5, services of hairdressers and personal grooming establishments and odontological services – 1.3% each, restaurants, cafes and the like – 1.2, and medical services – 1.1%.
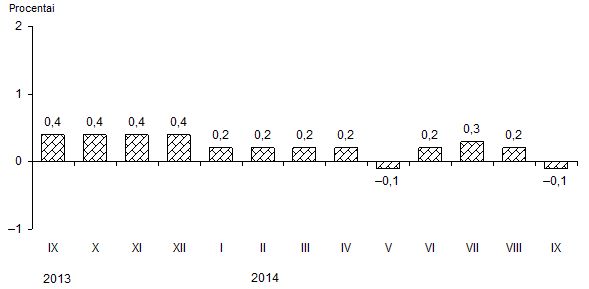
In September 2014, annual (September 2014, against September 2013) deflation was recorded, which stood at 0.1%. In September 2013, against September 2012, inflation stood at 0.4%.
 |
| Consumer price indices during the year, compared to the corresponding month of the previous year |
Annual deflation was mainly conditioned by a 17.7% decrease in prices for heat energy, 5.4% – fuels and lubricants, 11.2% – gas, 5.4% – electricity, 7.8% – vegetables, as well as by a 12.2% increase in prices for solid fuel, 11% – fruit, 6.5% – tobacco products, 3.5% – milk and dairy products, cheese and eggs, 4.8% – services of restaurants, cafes and the like, 14.3% – sewage collection services, 9% – coffee, tea and cocoa, 11.7% – housing rental.
Over the year, prices for consumer goods decreased by 0.8, for consumer services – grew by 2.2%.
In September 2014, compared to September 2013, prices for consumer goods and services regulated by State and municipal authorities decreased by 4.1%, while market prices increased by 0.6%.
In September 2014, average annual inflation stood at 0.2% and was by 1.5 percentage points lower than in September 2013 (1.7%).
Table 1. Changes in prices for consumer goods and services, September 2014, %
|
COICOP1 divisions of consumer goods and services |
Relative share (weight) of consumption expenditure in total consumption expenditure |
Price growth, drop (–) |
|||
|
September 2014, against |
average annual |
||||
|
August 2014
|
2013 |
September
2013–2014 |
|||
|
December |
September |
||||
|
Total CPI |
100.0 |
0.4 |
0.3 |
–0.1 |
0.2 |
|
Food products and non-alcoholic beverages |
25.2 |
0.8 |
1.0 |
0.9 |
0.8 |
|
Alcoholic beverages and tobacco products |
7.7 |
–0.1 |
4.1 |
4.3 |
3.3 |
|
Clothing and footwear |
7.0 |
5.6 |
–3.0 |
–1.7 |
–0.3 |
|
Housing, water, electricity, gas and other fuels |
14.1 |
–0.9 |
–2.4 |
–2.5 |
–0.7 |
|
Furnishings, household equipment and routine maintenance of the house |
4.9 |
0.0 |
–0.7 |
–0.6 |
0.1 |
|
Health care |
6.2 |
0.2 |
2.2 |
2.0 |
1.2 |
|
Transport |
14.2 |
–0.8 |
–0.4 |
–3.1 |
–1.3 |
|
Communications |
3.5 |
–0.3 |
–2.6 |
–3.7 |
–6.9 |
|
Recreation and culture |
6.0 |
–0.4 |
1.3 |
0.5 |
0.6 |
|
Educations |
1.7 |
1.0 |
0.9 |
0.9 |
1.1 |
|
Hotels, cafes and restaurants |
4.0 |
0.7 |
3.5 |
3.8 |
2.6 |
|
Miscellaneous goods and services |
5.5 |
1.9 |
1.5 |
1.3 |
0.9 |
1 Classification of Individual Consumption by Purpose (COICOP)
Table 2. Largest influence on the overall change in consumer prices over the month (September 2014, against August) by COICOP class of consumer goods and services
|
COICOP classes of consumer goods and services |
Relative share (weight) of consumption expenditure in total consumption expenditure,% |
Price growth, drop (–),% |
Influence, percentage points |
|
|
|
|
|
|
Clothing |
4.4 |
5.1 |
+0.204 |
|
Vegetables |
1.9 |
11.5 |
+0.168 |
|
Footwear |
2.4 |
7.0 |
+0.153 |
|
Other non-electric appliances, articles and products for personal care |
2.6 |
2.4 |
+0.062 |
|
Tobacco products |
2.3 |
2.2 |
+0.052 |
|
Services of restaurants, cafes and similar establishments |
2.4 |
1.2 |
+0.030 |
|
|
|
|
|
|
Passenger transport by air |
0.5 |
–14.9 |
–0.087 |
|
Heat energy |
3.1 |
–3.0 |
–0.079 |
|
Solid fuel |
1.9 |
–2.3 |
–0.049 |
|
Package holidays |
0.9 |
–4.3 |
–0.041 |
|
Beer |
1.5 |
–2.2 |
–0.035 |
|
Spirits |
2.6 |
–0.9 |
–0.024 |
The overall change in consumer prices is influenced not only by the size of the
price change for a certain product but also by the relative share (weight) of
expenditure on that product in the total consumption expenditure.
Concepts
Deflation refers to a long-lasting decrease in the general price level, which results in an increase in the purchasing power of money.
Inflation is a decrease in the purchasing power of a currency unit, which manifests itself in a long-term increase in the average general price level.
Annual inflation shows the relative change in the average price level between the reporting month and the corresponding month of the previous year.
Average annual inflation shows the relative change in the average price level between the last twelve months and the corresponding previous twelve months.
For more information, see the Database of Indicators.


 «The Baltic Course» Is Sold and Stays in Business!
