
Analytics, Inflation, Latvia, Markets and Companies
International Internet Magazine. Baltic States news & analytics
Wednesday, 24.04.2024, 22:18
Annual inflation Latvia made 1% in September
 Print version
Prices of goods grew by 0.2%, and prices of services increased by 3.4%. Compared to the previous 12 months, the average consumer price level over the last 12 months2 increased by 0.4%.
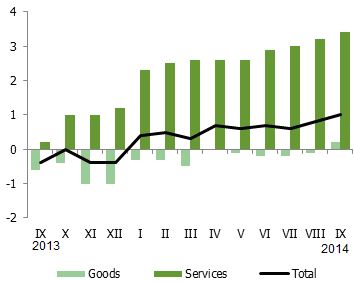 |
| Changes in consumer prices in 2013 and 2014 (% over the corresponding month of the previous year) |
Data source: Central Statistical Bureau of Latvia
The greatest pressure on the average level of consumer prices in September 2014, as compared to September 2013, was put by increase in prices of services related to housing, hotel and restaurant services, alcoholic beverages and tobacco, clothing and footwear, recreation and culture, as well as by drop in prices of transport goods and services.
The average food price level in September 2014 as compared to the corresponding month of the previous year decreased by 0.1%. Compared to the previous year lower prices were recorded for milk and dairy products, meat and meat products, sugar, oils and fats, eggs. In turn, an increase was recorded in the prices of vegetables, confectionery and honey, bread and cereals, and cheese.
Prices of tobacco grew by 8.3%, while the average price level of alcoholic beverages did not change.
Prices of footwear during the year increased by 7.4%, and prices of clothing grew by 1.4%.
During the year prices of services related to housing increased by 1.6%. It was influenced by the price growth for maintenance charges in multi-occupied buildings, solid fuel, water supply, actual rentals for housing, maintenance and repair of the dwelling, sewage collection; in turn, a decrease was recorded in the prices of heat energy.
In transport group prices declined by 1.5%, which was significantly affected by drop in prices of fuels for transport of 3.8%. Price drop was recorded for prices of spare parts and accessories for transport vehicles, and purchase of vehicles, while growth was observed in prices of maintenance and repair of personal transport equipment, and of passenger transport by sea.
Compared to September 2013, prices of hotel and restaurant services in September this year increased by 5.9%, mainly due to price growth in cafés and restaurants – of 6.2%, and in canteens – of 5.4%, as well as on accommodation services – of 6.3%.
Among other commodity groups growth was recorded in prices of cultural services, package holidays, recreational services, services of hairdressing salons and personal grooming establishments.
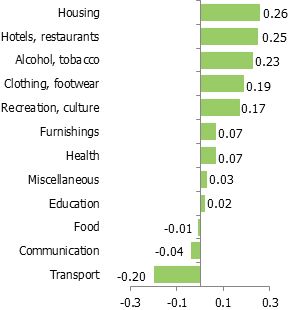 |
| Commodity group impact on Consumer Price Index over the last 12 months (percentage points) |
Compared to the previous month, consumer prices in September 2014 grew by 0.5%. The average level of prices of goods increased by 0.7%, whereas prices of services did not change.
The greatest pressure on consumer prices during the month was put by growth in prices of clothing and footwear, alcoholic beveragesand tobacco, individual care goods, recreation and culture, as well as by price drop for food and transport goods and services.
Prices of food decreased by 0.4%, which was affected by the expected drop in prices of milk and dairy products, of which of sour cream (-10.5%), curd (-11.5%), milk (-6.8%), kefir (-9.3%), sweet cream (-11.3%), and cheese (-0.7%). A drop was recorded in prices of meat and meat products, potatoes, oils and fats, fish and fish products. In turn, growth was observed in prices of vegetables, bread and cereals, fruit, tea and coffee.
Prices of alcoholic beverages increased by 1.3%, which was affected by the end of discounts for wine and spirits.
With the goods of the new season entering the market, prices of footwear grew by 13.9%, and prices of clothing rose by 5.2%.
Affected by seasonal factors, there was a drop in prices of passenger transport by sea. Decline was also recorded for the prices of fuels for transport (-0.4%), passenger transport by air and purchase of vehicles.
Prices of recreational and cultural goods and activities grew on average by 0.4%. An increase was recorded in prices of garden products and flowers, cultural services, recreation and sporting services; in turn, prices for package holidays witnessed a decrease.
With the end of sales campaigns growth was recorded for individual care goods, including cosmetics and articles for personal hygiene.
Among other commodity groups growth was recorded in prices of catering services, and with the beginning of a new school year an increase was observed in the prices of educational services. In turn, sanatorium services became cheaper.
Consumer price changes by commodity group, %
|
Commodity group |
Price changes in September 2014, compared to |
||
|
September 2013 |
December 2013 |
August 2014 |
|
|
Total |
1.0 |
1.1 |
0.5 |
|
Food |
-0.1 |
-0.8 |
-0.4 |
|
Alcohol, tobacco |
2.9 |
4.5 |
0.9 |
|
Clothing, footwear |
3.3 |
3.1 |
7.3 |
|
Housing |
1.6 |
1.5 |
0.1 |
|
Furnishings |
1.6 |
2.4 |
0.5 |
|
Health |
1.3 |
1.3 |
0.0 |
|
Transport |
-1.5 |
-0.7 |
-0.6 |
|
Communication |
-1.1 |
-0.7 |
-0.3 |
|
Recreation, culture |
2.2 |
2.4 |
0.4 |
|
Education |
1.5 |
1.5 |
1.5 |
|
Hotels, restaurants |
5.9 |
4.8 |
0.5 |
|
Miscellaneous |
0.6 |
0.9 |
1.4 |
Sub-indices having the greatest impact, percentage points
|
During a month |
|
|
Footwear |
+0.22 |
|
Vegetables |
+0.20 |
|
Clothing |
+0.18 |
|
Individual care goods |
+0.07 |
|
Bread and cereals |
+0.05 |
|
Potatoes |
-0.05 |
|
Meat and meat products |
-0.05 |
|
Milk and dairy products |
-0.23 |
|
During 12 months |
|
|
Tobacco |
+0.23 |
|
Vegetables |
+0.20 |
|
Cafés and restaurants |
+0.14 |
|
Footwear |
+0.13 |
|
Maintenance charges in multi-occupied buildings |
+0.11 |
|
Meat and meat products |
-0.08 |
|
Milk and dairy products |
-0.08 |
|
Fuels for transport |
-0.23 |
More detailed information on consumer price changes is available in the CSB database section Consumer prices.
1 The annual measure of inflation that
is used to compare the average monthly price level with the average price level
in the corresponding month of the previous year.
2 The average annual
measure of inflation that is used to compare the average price level of the
last 12 months with the average price level in 12 months of the previous year.


 «The Baltic Course» Is Sold and Stays in Business!
