
Analytics, Baltic States – CIS, EU – Baltic States, Investments, Lithuania, Markets and Companies
International Internet Magazine. Baltic States news & analytics
Saturday, 20.04.2024, 07:17
In Q2, FDI in Lithuania and Lithuanian direct investment abroad decreased
 Print version
Please note that this press release presents direct investment calculated applying a directional principle, i.e. by estimating reverse investment. Therefore, the data differ from the direct investment information provided in the balances of payments and international investment where an assets and liabilities approach is applied to the calculation of the said investment, following the updated Balance of Payments Manual.
Foreign direct investment in Lithuania
In II quarter 2014, based on provisional data, the FDI flow in Lithuania was negative (minus LTL 1 792.9 million, or minus EUR 519.3 million), i.e. investment in Lithuania decreased. The decrease was conditioned by an LTL 1 873.1 million decrease in investment in equity instruments. Compared to I quarter 2014, the negative change in the FDI flow stood at LTL 1.5 billion.
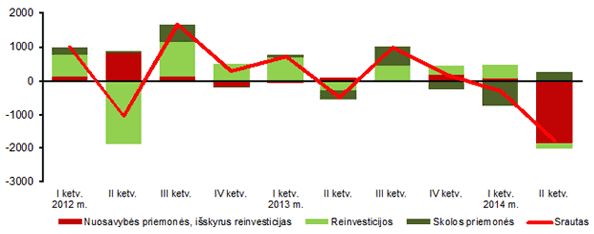 |
| Foreign direct investment flow in Lithuania, mln litas |
Foreign direct investment flow in Lithuania, LTL million
|
|
II quarter 2014 |
I quarter 2014 |
IV quarter 2013 |
|
Total |
–1 792.92 |
–291.78 |
173.29 |
|
Equity instruments, excl. reinvestment |
–1 873.08 |
46.54 |
155.76 |
|
Reinvestment |
–161.18 |
404.50 |
273.32 |
|
Debt instruments |
241.34 |
–742.82 |
–255.79 |
In II quarter 2014, the largest increase was observed in FDI from Poland (LTL
179.5 million), Latvia (LTL 118.9 million), and USA (LTL
104.3 million), while the largest decrease – in FDI from Germany (minus
LTL 1 188.9 million), Russia (minus LTL 763.5 million), and Estonia
(minus LTL 155.7 million).
Over II quarter 2014, the largest investment was made in manufacturing (LTL 436.4 million), financial and insurance activities (LTL 163.6 million), while the largest decrease in investment was observed in electricity, gas, steam and air conditioning supply (minus LTL 2 067.5 million).
As of 30 June 2014, cumulative FDI in Lithuania amounted to LTL 42.3 billion (EUR 12.2 billion). Over the first half-year 2014, it decreased by LTL 514.2 million (1.2%). FDI per capita amounted to, on average, LTL 14 424 (EUR 4 177) (as of 31 December 2013, LTL 14 537, or EUR 4 210).
According to the data of 30 June 2014, the largest investment in Lithuania was made by Swedish – LTL 10.6 billion (25.1% of the total FDI), Dutch – LTL 4.7 billion (11.1%), Polish – LTL 4 billion (9.6%), German – LTL 3.6 billion (8.5%), Norwegian – LTL 2.7 billion (6.3%), and Estonian – LTL 2.1 billion (5%) – investors.
Cumulative foreign direct investment in Lithuania, LTL million
|
|
2014-06-30 |
2014-03-31 |
2013-12-31 |
|
Total |
42 275.81 |
42 726.02 |
42 789.99 |
|
Equity instruments |
33 329.40 |
33 769.66 |
33 076.85 |
|
Debt instruments |
8 946.41 |
8 956.36 |
9 713.14 |
According to the data of 30 June 2014, the largest investment was made in
manufacturing – 27.6, financial and insurance activities – 22.7, real estate
activities – 13.3, wholesale and retail trade, repair of motor vehicles and
motorcycles – 10.6, information and communication – 9.3% of the total FDI. In
manufacturing, the largest investment was made in the manufacture of refined
petroleum products, chemicals and chemical products and pharmaceutical
preparations – LTL 7.1 billion (60.8% of the total FDI in manufacturing), food
products, beverages and tobacco products – LTL 1.1 billion (9.4%).
Lithuanian direct investment abroad
In II quarter 2014, the Lithuanian DI flow abroad was negative (minus LTL 19.5 million, or minus EUR 5.6 million), although in IV quarter 2013 and I quarter 2014 DI abroad increased and its flow made up, respectively, LTL 174.4 million and LTL 106.5 million. The decrease in the Lithuanian DI flow in II quarter 2014 was conditioned by a LTL 88.8 million decrease in investment in equity instruments.
Lithuanian direct investment flow abroad, LTL million
|
|
II quarter 2014 |
I quarter 2014 |
IV quarter 2013 |
|
Total |
–19.47 |
106.49 |
174.35 |
|
Equity instruments, excl. reinvestment |
–88.81 |
297.03 |
135.36 |
|
Reinvestment |
9.19 |
14.98 |
4.49 |
|
Debt instruments |
60.15 |
–205.52 |
34.50 |
In II quarter 2014, the largest growth in Lithuanian DI was observed in
Luxembourg (LTL 109.4 million) and Switzerland
(LTL 48.1 million), by economic activity – in professional,
scientific and technical activities (LTL 58.3 million) and manufacturing
(LTL 44.8 million). The largest drop in Lithuanian DI was observed in
Latvia (minus LTL 109.6 million) and Estonia (minus LTL
64 million), by economic activity – in financial and insurance activities
(minus LTL 108.5 million).
As of 30 June 2014, Lithuanian cumulative DI abroad amounted to LTL 6.5 billion (EUR 1.9 billion). Over the first half-year of 2014, it decreased by LTL 629.6 million, or 8.8%.
According to the data of 30 June 2014, the largest investment was made in the Netherlands – LTL 1.7 billion (25.9%), Poland – LTL 970.7 million (14.9%), Cyprus – LTL 918.6 million (14.1%), Estonia – LTL 871.4 million (13.3%), and Latvia – LTL 731.7 million (11.2% of the total Lithuanian DI abroad).
Lithuanian cumulative direct investment abroad, LTL million
|
|
2014-06-30 |
2014-03-31 |
2013-12-31 |
|
Total |
6 527.42 |
7 153.22 |
7 157.04 |
|
Equity instruments |
5 129.24 |
5 667.20 |
5 478.73 |
|
Debt instruments |
1 398.18 |
1 486.02 |
1 678.31 |
The largest investment abroad was made by Lithuanian enterprises in
professional, scientific and technical activities – LTL 2.5 billion
(38.8%), manufacturing – LTL 1.6 billion (24.5%), wholesale and
retail trade, repair of motor vehicles and motorcycles –
LTL 670.3 million (10.3%), and transportation and storage –
LTL 502.3 million (7.7% of the total Lithuanian DI abroad).
In manufacturing, the largest investment was made in the manufacture of refined petroleum, chemical and pharmaceutical preparations (79.4% of the total Lithuanian DI in manufacturing abroad).
For more detailed statistical information on cumulative FDI in Lithuania and Lithuanian DI abroad broken down by country and economic activity, see the Annex.
Information on III quarter 2014 direct investment will be published in January 2015.
Concepts
Equity instruments refers to company's equity capital comprised of equity securities, shares of investment funds, other assets (e.g. real estate), reinvestment, reserves included in equity capital.
Reinvestment refers to the proportion of direct investor's profit not distributed by subsidiary or partner companies in the form of dividend and profit of branches not transferred to the direct investor.
Debt instruments refers to financial instruments when it is obligatory to return the principal sum in the future and/or pay interest. It includes loans, debt securities, trade credits and advance payments, other amounts payable and receivable.
Anex. Table 1. Cumulative foreign direct investment by investing country
|
|
2014-06-30 |
2014-03-31 |
|||
|
LTL million |
structure, |
change, against 2014-03-31,% |
LTL million |
structure, |
|
|
Total |
42 275.81 |
100.0 |
–1.1 |
42 726.02 |
100.0 |
|
Sweden |
10 630.77 |
25.1 |
–0.4 |
10 671.90 |
25.0 |
|
Netherlands |
4 679.31 |
11.1 |
23.9 |
3 775.21 |
8.8 |
|
Poland |
4 049.23 |
9.6 |
3.5 |
3 911.64 |
9.2 |
|
Germany |
3 592.98 |
8.5 |
–16.1 |
4 281.21 |
10.0 |
|
Norway |
2 684.03 |
6.3 |
1.5 |
2 644.66 |
6.2 |
|
Estonia |
2 116.57 |
5.0 |
–3.9 |
2 203.12 |
5.2 |
|
Finland |
2 101.72 |
5.0 |
6.6 |
1 972.04 |
4.6 |
|
Denmark |
1 715.39 |
4.1 |
–1.9 |
1 748.29 |
4.1 |
|
Cyprus |
1 540.41 |
3.6 |
1.4 |
1 519.48 |
3.6 |
|
Russia |
1 216.94 |
2.9 |
–31.6 |
1 780.28 |
4.2 |
|
Luxembourg |
1 003.95 |
2.4 |
–3.7 |
1 042.33 |
2.4 |
|
Other countries |
6 944.51 |
16.4 |
–3.2 |
7 175.86 |
16.7 |
Table 2. Cumulative foreign direct investment by economic activity
|
|
2014-06-30 |
2014-03-31 |
|||
|
LTL million |
structure, |
change, against 2014-03-31,% |
LTL million |
structure, |
|
|
Total |
42 275.81 |
100.0 |
–1.1 |
42 726.02 |
100.0 |
|
Manufacturing |
11 669.27 |
27.6 |
11.4 |
10 475.52 |
24.5 |
|
Financial and insurance activities |
9 583.60 |
22.7 |
–0.5 |
9 635.27 |
22.6 |
|
Real estate activities |
5 617.09 |
13.3 |
0.3 |
5 600.59 |
13.1 |
|
Wholesale and retail trade; repair of motor vehicles and motorcycles |
4 483.07 |
10.6 |
–2.1 |
4 578.82 |
10.7 |
|
Information and communication |
3 925.80 |
9.3 |
–5.0 |
4 132.63 |
9.7 |
|
Professional, scientific and technical activities |
1 219.49 |
2.9 |
–12.6 |
1 395.75 |
3.3 |
|
Construction |
1 055.54 |
2.5 |
–0.5 |
1 061.23 |
2.5 |
|
Purchase and sale of real estate |
977.13 |
2.3 |
0.3 |
974.25 |
2.3 |
|
Electricity, gas, steam and air conditioning supply |
884.97 |
2.1 |
–59.0 |
2 156.71 |
5.0 |
|
Other |
2 859.85 |
6.7 |
5.3 |
2 715.25 |
6.3 |
Table 3. Lithuanian cumulative direct investment abroad by country
|
|
2014-06-30 |
2014-03-31 |
|||
|
LTL million |
structure, |
change, against 2014-03-31,% |
LTL million |
structure, |
|
|
Total |
6 527.42 |
100.0 |
–8.7 |
7 153.22 |
100.0 |
|
Netherlands |
1 689.71 |
25.9 |
1.4 |
1 666.47 |
23.3 |
|
Poland |
970.72 |
14.9 |
–6.5 |
1 038.37 |
14.5 |
|
Cyprus |
918.58 |
14.1 |
5.3 |
871.94 |
12.2 |
|
Estonia |
871.43 |
13.3 |
–8.7 |
953.98 |
13.3 |
|
Latvia |
731.67 |
11.2 |
–31.4 |
1 065.91 |
14.9 |
|
Russia |
247.91 |
3.8 |
–14.6 |
290.42 |
4.1 |
|
United Kingdom |
241.28 |
3.7 |
7.0 |
225.43 |
3.2 |
|
Ukraine |
134.10 |
2.0 |
–11.3 |
151.14 |
2.1 |
|
Belarus |
129.92 |
2.0 |
–55.4 |
291.28 |
4.1 |
|
Other countries |
592.10 |
9.1 |
–1.0 |
598.28 |
8.3 |
Table 4. Lithuanian cumulative direct investment abroad by economic
activity
|
|
2014-06-30 |
2014-03-31 |
|||
|
LTL million |
structure, |
change, against 2014-03-31,% |
LTL million |
structure, |
|
|
Total |
6 527.42 |
100.0 |
–8.7 |
7 153.22 |
100.0 |
|
Professional, scientific and technical activities |
2 529.92 |
38.8 |
–2.0 |
2 581.43 |
36.1 |
|
Manufacturing |
1 601.70 |
24.5 |
–5.6 |
1 696.24 |
23.7 |
|
Wholesale and retail trade; repair of motor vehicles and motorcycles |
670.25 |
10.3 |
–5.0 |
705.57 |
9.9 |
|
Transportation and storage |
502.33 |
7.7 |
1.7 |
493.81 |
6.9 |
|
Real estate activities |
365.44 |
5.6 |
–8.4 |
398.97 |
5.6 |
|
Financial and insurance activities |
357.95 |
5.5 |
–52.1 |
747.44 |
10.4 |
|
Information and communication |
177.83 |
2.7 |
–3.5 |
184.27 |
2.6 |
|
Purchase and sale of real estate |
166.62 |
2.6 |
–2.6 |
171.14 |
2.4 |
|
Construction |
78.85 |
1.2 |
–13.1 |
90.77 |
1.3 |
|
Other |
76.53 |
1.1 |
–8.4 |
83.58 |
1.1 |


 «The Baltic Course» Is Sold and Stays in Business!
