
Analytics, Economics, EU – Baltic States, GDP, Latvia, Markets and Companies
International Internet Magazine. Baltic States news & analytics
Saturday, 20.04.2024, 15:56
In Q2, GDP of Latvia grew by 2.3%
 Print version
According to seasonally non-adjusted data, in the 2nd quarter of 2014, compared to the 2nd quarter of 2013, GDP at constant prices has grown by 2.3%, but, according to seasonally adjusted data, compared to the 1st quarter of 2014, it has risen by 0.9%.
The calculations were carried out according to the new European System of Accounts (ESA 2010) methodology.
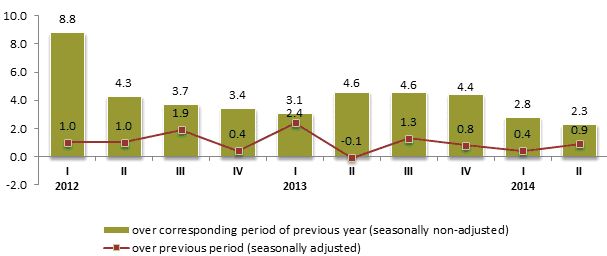 |
| Changes of GDP volume, 1st quarter 2012 - 2nd quarter 2014 (at constant prices, %) |
Data source: Central Statistical Bureau of Latvia
Production approach
In the 2nd quarter of 2014, as compared to the 2nd quarter of 2013,manufacturing rate at constant prices has grown by 0.1%, which was affected by 7.2% increase in manufacture of wood and of products of wood (26.3% of total manufacturing) and 3.9% increase in manufacture of food products (18.8% of total manufacturing). Manufacture of wearing apparel has reduced by 18.0% (2.6% of total manufacturing) and manufacture of beverages – by 17.0% (2.3% of total manufacturing).
Construction has gone up by 15.8%. Construction of residential buildings has grown by 67.3% (14.4% of total construction), construction of office buildings – by 18.0% (7.1% of total construction) and construction of industrial buildings and warehouses – by 30.4% (6.0% of total construction). Construction of highways, streets, roads, airfield runways, railways witnessed drop of 2.4% (19.3% of total construction).
Retail trade grew by 4.3%, of which retail sale of automotive fuel – by 6.1%. Trade of food products rose by 5.9% and trade of non-food products – by 3.4%.
In transport sector freight transport by road grew by 11%.
In accommodation and food service activities there was an increase of 6.5% and 6.0%. Activity of travel agencies has gone up by 4.4%.
Rise in entertainment and recreation sector comprised 12.2%, but in gambling and betting sector – 19.7%.
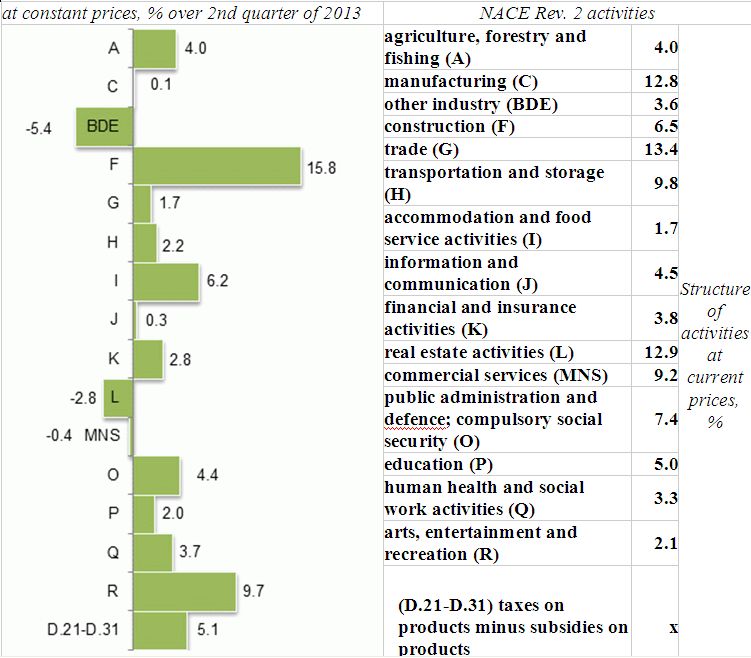 |
| Changes of GDP in the 2nd quarter of 2014 by kind of economic activity |
Data source: Central Statistical Bureau of Latvia
Expenditure approach
In the 2nd quarter of 2014, compared to the 2nd quarter of 2013,private final consumption at current prices grew by 2.8 %. Rise was observed within two main groups of consumption expenditure: food (19% of total expenditure) – of 6.0% and transport (11% of total expenditure) – of 2.0%. Households' expenditure on housing, which comprises 23% of total expenditure remained at the level of the previous year. Gross fixed capital formation increased by 1.4%. Export of goods (72% of total exports) has risen by 1.4%, but exports of services – reduced by 2.5%. Volume of imports of goods (86% of total imports) has risen by 2.6%, but imports of services – decreased by 5.4%.
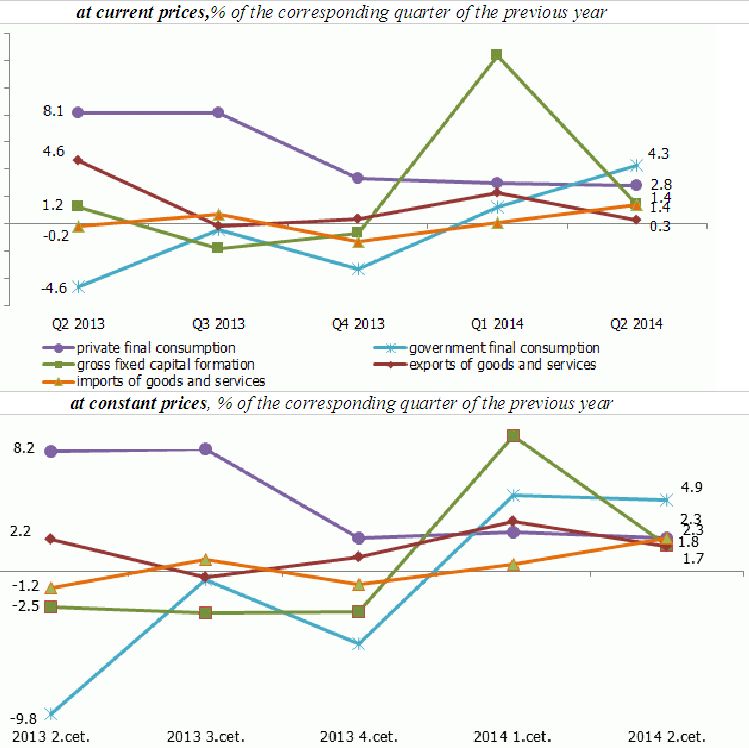 |
| Gross domestic product by main expenditure items |
Data source: Central Statistical Bureau of Latvia
Compared to the 2nd quarter of 2013, private final consumption in the 2nd quarter of 2014 at constant prices grew by 2.3%, of which expenditure on food – by 6.1%, but expenditure on transport – rose by 0.7%. Expenditure on housing decreased by 0.9%.
Expenditure on gross fixed capital formation increased by 1.8%. Volume of investment in public administration sector has grown by 18.0%, in manufacturing – by 32.1%. However, in general there was observed a 9.5% decrease of investment in industry.
Export of goods increased by 3.5%, but export of services – reduced by 2.8%. Import of goods went up by 3.7%, while import of services – dropped by 5.3%.
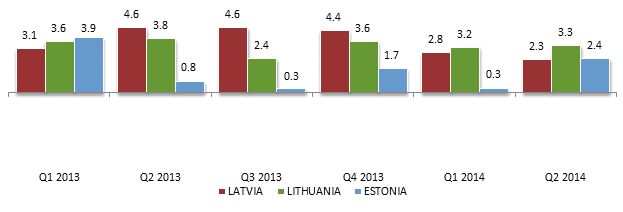 |
| Changes of Gross Domestic Product in the Baltic Countries (at constant prices, % of the corresponding period of the previous year) |
Data source: Central Statistical Bureau of Latvia
Time series from the 1st quarter of 1995 to the 1st quarter of 2014 were recalculated in the CSB according to the European Parliament and Council Regulation (EU) No. 549/2013 on the changes in the European system of national and regional accounts in the European Union (ESA 2010) and other changes.
Changes in the calculation of gross domestic product
Central Statistical Bureau (CSB) has carried out recalculation of annual and quarterly national accounts time series from 1995. The results obtained prove negative impact of emigration of Latvian population on the estimates of state economics during the last years established in Population and Housing Census 2011, informs Intars Abražuns.
The recalculation was carried out to implement transformation of the data of the system of national accounts according to new methodological principles in compliance with the Regulation (EU) No 549/2013 of the European Parliament and of the Council of 21 May 2013 on the requirements of the European system of national and regional accounts (ESA 2010).
ESA 2010 is developed in compliance with the System of National Accounts SNA 2008 confirmed by the United Nations Statistical Commission in 2010, thus ensuring availability of harmonized and comparable information on macroeconomics to the users of all levels worldwide. Not changing previous key principles of these documents, changes were introduced both in SNA 2008 and ESA 2010 which help better to perceive development trends in world economics and expression of globalisation processes. All European Union (EU) member states finish transformation of the data of system of national accounts according to the new methodological principles on September 2014. Statistical office of the EU Eurostat is planning to inform statistical data users on the results of recalculations carried out in member states in press conference on 17 October of this year.
Within the framework of the EU this information also helps to define political and administrative aims, because data of the system of national accounts are used:
· for EU budgetary aims – for determination of instalment in the EU budget;
· for fiscal policy – for comparisons of government budgetary deficit and debt levels;
· for the EU subsidy policy;
· for determination and analysis of macroeconomics imbalance procedure.
The same as statistical institutions of other EU member states, parallel to the implementation of methodological requirements ESA 2010, in calculations of national accounts CSB has used new data sources for the improvement of methodology used until now in order to eliminate some imperfections, which was indicated by the European Commission (EC) in a special disclaimer. Also data adjustment was carried out, commensurating results of the Population and Housing Census 2011 with key indicators of the system of national accounts.
Changes of values and their relative size by years differs significantly – from increase of gross domestic product (GDP) by 8.4% in 1995 to reduction of GDP by 0.2% in 2012. Changes of GDP in million euros and per cent over the previously published data in some years of the last decade can be found in the table.
Annual GDP changes in mln EUR and in % over the previously published data of national accounts
|
Factors affecting changes |
|
2005 |
2007 |
2008 |
2009 |
2010 |
2011 |
2012 |
|
Changes caused by methodology of ESA 2010 |
mln EUR |
82 |
100 |
127 |
144 |
201 |
217 |
207 |
|
% |
0.6 |
0.5 |
0.6 |
0.8 |
1.1 |
1.1 |
0.9 |
|
|
Impact of statistical adjustment – special disclaimer of the EC, Population Census 2011, regular revisions |
mln EUR |
716 |
1 491 |
1 387 |
153 |
-225 |
-231 |
-247 |
|
% |
5.6 |
7.1 |
6.1 |
0.8 |
-1.2 |
-1.0 |
-1.1 |
|
|
Changes, total |
mln EUR |
798 |
1 591 |
1 513 |
296 |
-24 |
-14 |
-40 |
|
% |
6.2 |
7.6 |
6.6 |
1.6 |
-0.1 |
-0.1 |
-0.2 |
Short term and annual statistical data on gross domestic product can be found in the CSB database.
More information on the revision carried out can be found on the news release “Changes were carried out in calculations of gross domestic product”.
More detailed information on the seasonally non-adjusted time series is available in the CSB database in section Gross Domestic Product.
More detailed seasonally adjusted time series will be published on 3 October this year in the CSB database in section Gross Domestic Product.


 «The Baltic Course» Is Sold and Stays in Business!
