
Analytics, Economics, Estonia, EU – Baltic States, GDP, Markets and Companies
International Internet Magazine. Baltic States news & analytics
Saturday, 20.04.2024, 12:23
New methodology: economy of Estonia grew by 2.4% in Q2
 Print version
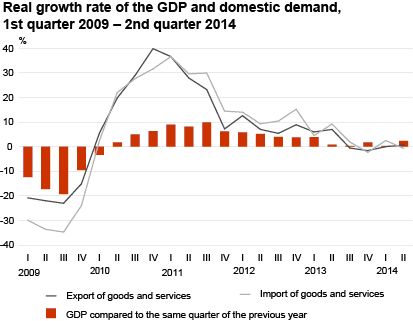
The GDP has been calculated on the basis of the methodology of the new European System of National and Regional Accounts, ESA 2010. In the 2nd quarter, the seasonally and working-day adjusted GDP increased by 1.1% compared to the 1st quarter of 2014 and 2.9% compared to the 2nd quarter of 2013.
In the 2nd quarter, the GDP at current prices was 4.9 billion euros.
In the 2nd quarter of 2014, the GDP growth was influenced the most by a rise in the value added in professional, scientific and technical activities, trade and energy. The GDP growth was also positively influenced by increased receipts of excise taxes and value added tax, which are a part of net taxes on products. The value added in construction slowed the Estonian economy down the most, mainly due to decreased construction volumes. In addition, the GDP growth was substantially decelerated by a decrease in health and transportation.
The export of goods decreased for the fourth quarter in a row, while the export of services continued to increase. The decrease in the export of goods was influenced the most by a deceleration in the export of electronic, other manufacturing and chemical products. The import of goods and services decreased at real prices by 0.7%.
Net export was positive in the 2nd quarter of 2014, amounting to 3.7% of the GDP. The previous time that net exports were on a similar level was in 2011.
The Estonian economy was continuously supported by growing domestic demand. Domestic demand increased at real prices by 4.4%, mainly due to the household final consumption expenditure and changes in inventories. The household final consumption expenditure increased by 3.6%. The expenditures on food, clothing and catering services increased the most. Inventories grew mainly due to an increase in the inventories of goods and raw materials.
The gross fixed capital formation increased by 0.7% in the 2nd quarter. The growth was mostly influenced by the investments in buildings and structures by the sector of non-financial corporations. At the same time, the investments of the general government sector and the investments of non-financial corporations in transport equipment decreased.
In the 2nd quarter, domestic demand was smaller than the GDP, accounting for 96.9% of the GDP.
Statistics Estonia revised the GDP time series data from 2000 onwards. The data have been recalculated on the basis of the European Parliament and the Council Regulation (EU) No 549/2013 on the European system of national and regional accounts in the European Union (ESA 2010). In addition to the above-mentioned revisions, the reference year of the GDP calculated with the chain-linked method was shifted from 2005 to 2010.
Additional information about the revisions is available here.


 «The Baltic Course» Is Sold and Stays in Business!
