
Analytics, Inflation, Latvia, Markets and Companies
International Internet Magazine. Baltic States news & analytics
Thursday, 25.04.2024, 06:48
Annual inflation in Latvia constituted 0.8% in August
 Print version
Compared to the previous 12 months, the average consumer price level over the last 12 months2, increased by 0.3%.
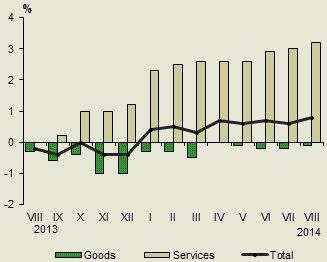 |
| Changes in consumer prices in 2013 and 2014
(% over the corresponding month of the previous year) |
The greatest pressure on the average level of consumer prices in August 2014, as compared to August 2013, was put by the increase in prices of services related to housing, hotel and restaurant services, alcoholic beverages and tobacco, recreational and cultural goods and activities, as well as by the price drop of transport goods and services.
The average food price level in August 2014 as compared to the corresponding month of the previous year has remained the same. Price rise was recorded for milk and dairy products, confectionery and honey, fish and fish products. In its turn prices of fruit, sugar, vegetables, bread and cereals dropped.
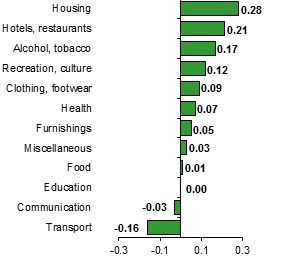 |
| Commodity group impact on Consumer Price Index over the last 12 months (percentage points) |
Prices of tobacco grew by 8.5%, while prices of alcoholic beverages decreased by 1.4%.
During the year prices of services related to housing increased by 1.7% due to the price growth for the services of maintenance charges in multi-occupied buildings, solid fuel, maintenance and repair of the dwelling, water supply, actual rentals for housing, sewage collection, but prices of heat energy decreased.
In transport group prices reduced by 1.2%, that was mainly affected by price drop of fuels for transport by 3.6%. Prices of spare parts and accessories for transport vehicles reduced, but prices for maintenance and repair services of personal transport equipment and for passenger transport by sea increased.
As compared to August 2013, prices of hotel and restaurant services in August this year increased by 5.1%, mainly due to price growth in cafés and restaurants of 6.7% and in canteens – of 3.3%, as well as on accommodation services – by 0.9%.
Among other consumption groups, the most significant increase was recorded in prices of footwear, cultural services, and services of hairdressing salons and personal grooming establishments.
As compared to the previous month, consumer prices in August 2014 decreased by 0.6%. The average price level of goods declined by 0.9%, whereas the average price level of services rose by 0.1%.
The greatest pressure on the consumer prices during the month were put by drop in prices of food, transport goods and services, individual care goods, footwear, as well as by growth in the prices of clothing, alcoholic beverages and tobacco.
Prices of food decreased by 1.9%. Affected by seasonal factors, the drop was recorded in prices of vegetables. Prices of sugar, confectionery and honey, bread and cereals also reduced. In August price drop was recorded for milk and dairy products (price decrease of milk and kefir had the greatest downward impact). In turn, price rise was recorded for ground coffee, fruit, fish and fish products, as well as for oils and fats.
Prices dropped on fuels for transport (-2.0%), as well as on motor cars, bicycles and passenger transport by air.
Influenced by sales campaigns individual care goods, including, cosmetics, articles for personal hygiene became cheaper.
Influenced by sales campaigns, prices of footwear reduced by 5.2%. In turn, prices of clothing increased by 0.8%.
Prices of tobacco during the month have risen by 0.5%, but of alcoholic beverages – by 0.1%.
In other commodity groups price drop was observed for sewage collection, hotel services. In turn, prices for package holidays (mainly, air flights), catering services and actual rentals for housing increased.
Consumer price changes by commodity group, %
|
Commodity group |
Price changes in August 2014, compared to: |
||
|
August 2013 |
December 2013 |
July 2014 |
|
|
Total |
0.8 |
0.6 |
-0.6 |
|
Food |
0.0 |
-0.4 |
-1.9 |
|
Alcohol, tobacco |
2.0 |
3.6 |
0.3 |
|
Clothing, footwear |
1.7 |
-3.9 |
-1.0 |
|
Housing |
1.7 |
1.4 |
0.0 |
|
Furnishings |
1.1 |
1.9 |
0.2 |
|
Health |
1.3 |
1.4 |
0.3 |
|
Transport |
-1.2 |
-0.2 |
-1.0 |
|
Communication |
-0.9 |
-0.4 |
0.1 |
|
Recreation, culture |
1.5 |
2.0 |
0.5 |
|
Education |
0.1 |
-0.1 |
0.1 |
|
Hotels, restaurants |
5.1 |
4.3 |
0.2 |
|
Miscellaneous |
0.6 |
-0.4 |
-0.9 |
Sub-indices having the greatest impacts, percentage points
|
During a month |
|
|
Ground coffee |
+0.05 |
|
Package holidays |
+0.05 |
|
Beer |
+0.04 |
|
Wine |
-0.04 |
|
Sugar, confectionery, honey |
-0.04 |
|
Footwear |
-0.09 |
|
Fuels for transport |
-0.13 |
|
Vegetables |
-0.49 |
|
During 12 months |
|
|
Tobacco |
+0.23 |
|
Milk and dairy products |
+0.18 |
|
Cafés and restaurants |
+0.15 |
|
Footwear |
+0.11 |
|
Maintenance charges in multi-occupied buildings |
+0.10 |
|
Heat energy |
-0.08 |
|
Fruit |
-0.15 |
|
Fuels for transport |
-0.22 |
Information on Consumer Price Index in September 2014 will be published on October 8.
More detailed information on consumer price changes is available in the CSB database section Consumer prices.
1The annual measure of inflation that is used to compare the average monthly price level with the average price level in the corresponding month of the previous year.
2The average annual measure of inflation that is used to compare the average price level of the last 12 months with the average price level in 12 months of the previous year.


 «The Baltic Course» Is Sold and Stays in Business!
