
Analytics, Economics, GDP, Lithuania, Markets and Companies
International Internet Magazine. Baltic States news & analytics
Thursday, 18.04.2024, 01:28
In Q2, GDP in Lithuania grew by 3.1%
 Print version
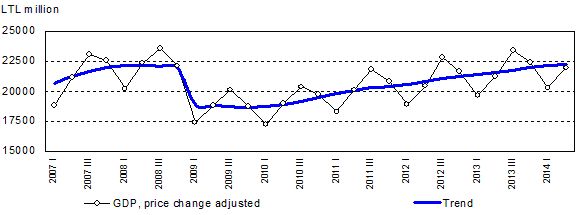
According to revised data, in II quarter 2014, against the same quarter of 2013, positive change in the value added was observed in almost all activities, except agriculture, forestry and fishing. The fastest growth in the value added was observed in enterprises engaged in construction (14.3%), manufacturing (3.8%), trade, repair of motor vehicles and motorcycles, transportation and storage, accommodation and food service activities (3.8%), professional, scientific and technical, administrative and support activities (3.3%), mining and quarrying, water supply, sewerage, waste treatment and remediation activities (3.3%). In enterprises engaged in other activities, the growth in the value added was slower than in the whole economy. In II quarter 2014, against II quarter 2013, the value added of enterprises engaged in agricultural, forestry and fishing activities decreased by 5.5% (the GDP changes provided were estimated seasonally and working day adjusted).
According to revised data, in I half-year 2014, GDP at current prices amounted to LTL 59 055 million (EUR 17 103.5 million). Compared to I half-year 2013, real GDP change, seasonally and working day adjusted, stood at 3.1% (seasonally and working day unadjusted, GDP increased by 3.3%).
 |
| GDP changes (1) |
As for GDP estimated by expenditure approach, in II quarter 2014, against the same quarter of 2013, an increase was observed in almost all GDP components. Gross fixed capital formation grew by 8, final household consumption expenditure – 4.8, that of general government – 2.3%. Exports of goods and services decreased by 0.2, imports – 1.2%.
Table 1. GDP changes
|
|
At current pr ices |
GDP changes, % |
||||
|
LTL million |
EUR million |
compared to the previous period |
compared to the same period of the previous year |
seasonally and working day adjusted |
||
|
compared to the previous period |
compared to the same period of the previous year |
|||||
|
2010 |
95 676.0 |
27 709.7 |
1.6 |
1.6 |
1.5 |
1.5 |
|
I |
21 437.9 |
6 208.8 |
–7.8 |
–0.9 |
0.7 |
–1.1 |
|
II |
24 360.5 |
7 055.3 |
10.3 |
1.2 |
1.1 |
1.2 |
|
III |
25 041.7 |
7 252.6 |
6.8 |
0.9 |
0.6 |
1.4 |
|
IV |
24 835.9 |
7 193.0 |
–3.1 |
5.1 |
2.3 |
4.7 |
|
2011 |
106 893.4 |
30 958.5 |
6.0 |
6.0 |
6.1 |
6.1 |
|
I |
23 590.2 |
6 832.2 |
–7.3 |
5.7 |
1.9 |
6.0 |
|
II |
27 296.6 |
7 905.6 |
10.1 |
5.6 |
1.5 |
6.4 |
|
III |
28 607.4 |
8 285.3 |
8.3 |
7.1 |
0.8 |
6.7 |
|
IV |
27 399.2 |
7 935.4 |
–4.4 |
5.7 |
1.1 |
5.4 |
|
2012◘ |
113 734.7 |
32 939.8 |
3.7 |
3.7 |
3.5 |
3.5 |
|
I |
25 541.1 |
7 397.2 |
–9.0 |
3.8 |
0.3 |
3.7 |
|
II |
28 490.8 |
8 251.5 |
8.0 |
1.8 |
0.7 |
2.9 |
|
III |
30 495.0 |
8 832.0 |
11.7 |
5.0 |
2.0 |
4.2 |
|
IV |
29 207.9 |
8 459.2 |
–5.2 |
4.0 |
0.2 |
3.3 |
|
2013* |
119 574.8 |
34 631.2 |
3.3 |
3.3 |
3.5 |
3.5 |
|
I |
26 545.5 |
7 688.1 |
-9.4 |
3.6 |
1.0 |
4.1 |
|
II |
30 230.8 |
8 755.5 |
8.3 |
3.8 |
0.8 |
4.1 |
|
III |
32 229.3 |
9 334.3 |
10.1 |
2.4 |
0.4 |
2.4 |
|
IV |
30 569.1 |
8 853.4 |
–4.1 |
3.6 |
1.2 |
3.4 |
|
2014 |
|
|
|
|
|
|
|
I* |
27 740.1 |
8 034.1 |
–9.7 |
3.2 |
0.7 |
3.1 |
|
II♦ |
31 315.1 |
9 069.5 |
8.4 |
3.3 |
0.8 |
3.1 |
Table 2. Changes in gross value added1 by group of economic activity, compared to the corresponding period of the previous year, %
|
|
A |
B + C + D + E |
C |
F |
G + H + I |
J |
K |
L |
M + N |
O + P + Q |
R + S + T |
|
2010 |
−6.8 |
6.5 |
8.7 |
−5.4 |
4.3 |
1.9 |
10.2 |
−1.3 |
−2.5 |
−2.4 |
−6.2 |
|
I |
2.2 |
0.5 |
−2.0 |
−17.6 |
2.0 |
2.2 |
3.5 |
−1.5 |
−6.6 |
−3.4 |
−11.0 |
|
II |
−5.0 |
4.7 |
6.5 |
−7.4 |
4.5 |
1.9 |
3.8 |
−1.4 |
−2.9 |
−2.9 |
−7.2 |
|
III |
−21.6 |
6.5 |
10.2 |
−0.1 |
6.7 |
3.5 |
17.3 |
−1.1 |
−1.1 |
−1.7 |
0.2 |
|
IV |
−0.8 |
14.7 |
21.0 |
5.9 |
4.0 |
0.2 |
17.5 |
−1.2 |
0.8 |
−1.5 |
−6.3 |
|
2011 |
8.4 |
7.1 |
10.0 |
18.6 |
8.1 |
−4.3 |
9.4 |
1.4 |
3.7 |
0.2 |
4.3 |
|
I |
1.1 |
11.4 |
17.1 |
15.9 |
9.4 |
−6.4 |
5.8 |
−0.5 |
1.9 |
−1.0 |
3.4 |
|
II |
4.9 |
11.3 |
12.8 |
15.5 |
7.1 |
−4.4 |
12.7 |
1.4 |
3.3 |
0.2 |
1.5 |
|
III |
18.0 |
7.6 |
9.1 |
19.0 |
7.2 |
−4.9 |
13.3 |
0.9 |
4.6 |
0.4 |
3.3 |
|
IV |
10.6 |
−1.1 |
2.1 |
23.5 |
8.6 |
−1.5 |
5.8 |
3.9 |
4.9 |
1.1 |
9.1 |
|
2012◘ |
11.3 |
2.8 |
5.1 |
–5.4 |
6.9 |
4.7 |
–2.0 |
1.2 |
2.2 |
0.5 |
3.5 |
|
I |
9.2 |
–0.7 |
2.9 |
5.5 |
6.3 |
4.9 |
3.4 |
3.3 |
3.3 |
0.8 |
1.0 |
|
II |
12.3 |
–1.0 |
1.8 |
–1.7 |
7.5 |
5.4 |
0.3 |
1.0 |
2.5 |
0.2 |
6.1 |
|
III |
17.2 |
5.1 |
7.3 |
–10.7 |
7.0 |
4.3 |
–5.6 |
1.5 |
1.4 |
0.4 |
4.3 |
|
IV |
6.8 |
7.8 |
8.4 |
–13.3 |
6.8 |
4.2 |
–5.9 |
–0.8 |
1.7 |
0.5 |
2.6 |
|
2013* |
–1.3 |
4.3 |
4.9 |
10.4 |
4.1 |
2.2 |
3.8 |
0.8 |
3.6 |
1.5 |
1.7 |
|
I |
6.7 |
9.2 |
7.3 |
–2.0 |
5.4 |
2.7 |
–2.5 |
–0.2 |
2.1 |
1.0 |
3.1 |
|
II |
–0.3 |
6.0 |
7.8 |
8.2 |
4.2 |
1.0 |
4.0 |
1.3 |
3.3 |
1.7 |
0.9 |
|
III |
–8.6 |
0.5 |
1.5 |
16.1 |
3.7 |
2.7 |
4.2 |
1.2 |
4.1 |
1.7 |
0.3 |
|
IV |
–2.1 |
2.0 |
3.3 |
20.1 |
3.0 |
2.2 |
9.8 |
1.1 |
4.9 |
1.6 |
2.6 |
|
2014 |
|
|
|
|
|
|
|
|
|
|
|
|
I* |
–9.1 |
1.5 |
3.6 |
26.3 |
3.6 |
0.0 |
1.7 |
3.5 |
3.6 |
1.1 |
2.3 |
|
II♦ |
−5.5 |
3.3 |
3.8 |
14.3 |
3.8 |
1.9 |
0.7 |
1.6 |
3.3 |
0.6 |
1.0 |
A – agriculture,
forestry and fishing;
B + C + D + E – mining and quarrying; manufacturing; electricity, gas, steam
and air conditioning supply; water supply; sewerage, waste treatment and
remediation activities;
C – manufacturing;
F – construction;
G + H + I – wholesale and retail trade; repair of motor vehicles and
motorcycles; transportation and storage; accommodation and food service
activities;
J – information and communication;
K – financial and insurance activities;
L – real estate activities;
M + N – professional, scientific and technical activities; administrative and
support service activities;
O + P + Q – public administration and defence; compulsory social security;
education; human health and social work;
R + S + T – arts, entertainment and recreation; repair of household goods and
other services.
Table 3. Changes in the main components of GDP estimated1 by expenditure approach, compared to the corresponding period of the previous year, %
|
|
Final consumption expenditure |
Gross fixed capital formation |
Exports of goods and services |
Imports of goods and services |
||
|
Total |
Household consumption expenditure |
General government consumption expenditure |
||||
|
2009 |
−13.7 |
−17.9 |
−1.4 |
−39.5 |
−12.2 |
−28.1 |
|
I |
−11.7 |
−16.5 |
0.2 |
−31.9 |
−10.3 |
−29.9 |
|
II |
−13.3 |
−17.1 |
0.2 |
−43.4 |
−18.4 |
−30.5 |
|
III |
−14.7 |
−18.1 |
−3.1 |
−45.6 |
−13.9 |
−27.8 |
|
IV |
−15.2 |
−19.8 |
−2.9 |
−36.9 |
−5.9 |
−23.9 |
|
2010 |
−3.6 |
−3.9 |
−3.5 |
1.8 |
16.9 |
17.8 |
|
I |
−7.8 |
−7.5 |
−3.8 |
−23.9 |
5.6 |
9.9 |
|
II |
−6.7 |
−6.2 |
−4.8 |
−3.4 |
18.2 |
18.0 |
|
III |
−1.1 |
−3.3 |
−2.3 |
22.8 |
21.7 |
19.0 |
|
IV |
1.7 |
2.0 |
−2.9 |
19.1 |
22.4 |
23.8 |
|
2011 |
3.8 |
4.7 |
0.4 |
20.8 |
15.1 |
12.6 |
|
I |
2.3 |
4.3 |
−1.0 |
33.3 |
22.9 |
22.2 |
|
II |
4.5 |
5.3 |
0.6 |
27.0 |
18.7 |
16.5 |
|
III |
3.5 |
4.8 |
0.3 |
12.6 |
12.6 |
10.2 |
|
IV |
4.9 |
4.2 |
1.6 |
13.7 |
7.7 |
3.4 |
|
2012◘ |
2.7 |
4.1 |
0.7 |
−3.6 |
11.3 |
7.1 |
|
I |
3.1 |
5.1 |
0.8 |
2.5 |
5.4 |
4.2 |
|
II |
3.0 |
3.1 |
0.4 |
−2.5 |
6.6 |
2.1 |
|
III |
2.5 |
3.8 |
1.0 |
−6.3 |
14.3 |
9.6 |
|
IV |
2.4 |
4.3 |
0.5 |
−7.6 |
18.8 |
12.5 |
|
2013* |
4.5 |
5.2 |
1.8 |
12.7 |
10.3 |
10.6 |
|
I |
4.4 |
3.2 |
1.6 |
5.3 |
19.7 |
14.2 |
|
II |
4.4 |
5.9 |
1.7 |
11.6 |
15.3 |
15.8 |
|
III |
4.9 |
6.1 |
1.5 |
18.0 |
6.6 |
8.2 |
|
IV |
4.4 |
5.4 |
2.3 |
16.2 |
1.4 |
4.9 |
|
2014 |
|
|
|
|
|
|
|
I* |
3.9 |
4.7 |
2.3 |
9.4 |
–3.4 |
–1.3 |
|
II♦ |
4.2 |
4.8 |
2.3 |
8.0 |
−0.2 |
1.2 |
♦ Second estimate * Provisional
data ◘ Non-final
data
___________________
1 Seasonally and
working day adjusted
Real GDP changes have been estimated using a chain-linking method, which enables the elimination of the influence of price changes.
In order to ensure comparability across the countries, data on GDP changes published by Eurostat are seasonally and working day adjusted.
In September 2014, revised methodological provisions of the European System of National and Regional Accounts (ESA 2010 instead of the currently effective ESA 1995) will come into force, on the basis of which national accounts aggregates will be produced and published. The time series of the main national accounts aggregates will be revised from 2005; in 2015, earlier periods' time series will also be revised and published.
More information on the issue is available in the Database of Indicators.


 «The Baltic Course» Is Sold and Stays in Business!
