
Analytics, Inflation, Lithuania, Markets and Companies
International Internet Magazine. Baltic States news & analytics
Friday, 19.04.2024, 16:42
In July, annual inflation in Lithuania stood at 0.3%
 Print version
It was mainly influenced by a decrease in prices for clothing, footwear and gas, as well as by an increase in prices for passenger transport by air, package holidays, coffee, tea and cocoa, services of cafes and restaurants, non-hospital-based other medical services, meat (see Table 2).
Over the said period, prices for consumer goods decreased by 1%, while prices for consumer services increased by 1%. An increase in consumer service prices was observed for the fourth month in a row.
Prices for consumer goods and services regulated by State and municipal authorities decreased by 0.9%, market prices – 0.4%. The influence of the change in prices regulated by State and municipal authorities and market prices was negative and stood at minus 0.13 and minus 0.37 percentage points.
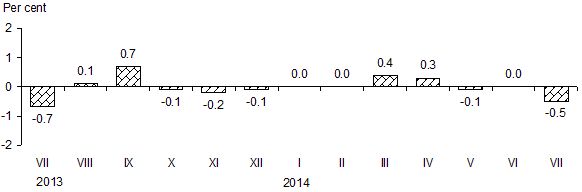 |
| Fig. 1. Monthly changes in prices for consumer goods and services, compared to the previous month |
In July 2014, against June, due to seasonal discounts, prices for clothing decreased by 7.6, footwear – 7.5%. Prices for other articles of clothing and clothing accessories decreased by 1.1%, while prices for clothing cleaning, repair and rental services grew by 0.4%.
As for housing, water, electricity, gas and other fuels goods and services, the largest decrease in prices was observed for natural gas – 18.9, and fire wood – 2.2%. Refuse collection service prices went up by 1.4, housing rent – by 0.4%.
As regards food products and non-alcoholic beverages, the largest decrease in prices was observed for early potatoes – 25.7%, cabbages – 25.1%, cucumbers – 21.3%, grapes – 7.9%, green vegetables – 6%. A decrease in prices was also observed for pears – 1.8%, oil – 1.5%, sugar – 1%. However, prices for bulb vegetables increased by 5.7%, coffee – 5.4%, citrus fruit – 2.3, fruit and vegetable juice – 2.2%.
The most noticeable increase in the group of transport goods and services was observed in prices for passenger transport by air services – 14.9%. Prices for liquefied gas for cars grew by 0.7%, petrol – 0.2%, while prices for bicycles dropped by 1.3%, diesel fuel – 1.1%.
As for recreational and cultural goods and services, the largest increase in prices – by 5.8% – was observed for newspapers and periodicals, 4.7% – package holidays, 2.4% – toys and games. Prices for equipment for sports, camping and open-air recreation dropped by 7%, flowers – 2.3%, recording media – 1.3%, information processing equipment – 1.2%.
In July 2014, annual (July 2014, against July 2013) inflation stood at 0.3% and was by 0.2 percentage points lower than in July 2013 (in July 2013, against July 2012, inflation stood at 0.5%).
The annual inflation rate was mainly influenced by an increase in prices for solid fuel – 17.9, milk, cheese and eggs – 6.1, tobacco products – 4.2, sewage collection services – 18.2, services of restaurants and cafes – 3.2, beer – 6.3, cold water – 15.2, refuse collection services – 13.7, fuels and lubricants – 1.2, housing rent – 9.7, spirits – 1.1%, as well as by a decrease in prices for heat energy – 17.3, gas – 13.9, telephone and telefax services – 5.2, electricity – 5.4%.
Over the year, prices for consumer goods decreased by 0.1, those for services increased by 1.6%.
In July 2014, compared to July 2013, prices for consumer goods and services regulated by State and municipal authorities decreased by 4%, while market prices increased by 1.1%.
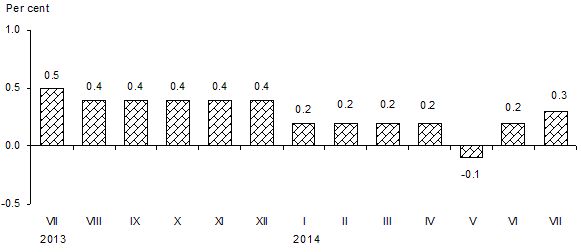 |
| Fig. 2. Annual changes in prices for consumer goods and services, compared with the corresponding month of the previous year |
In July 2014, average annual inflation stood at 0.3% and was by 1.9 percentage points lower than in July 2013 (2.2%).
Table 1. Changes in prices for consumer goods and services, July 2014, %
|
COICOP1 divisions of consumer goods and services |
Relative s |
Price growth, drop (–) |
|||
|
July 2014, against |
average annual |
||||
|
June 2014 |
2013 |
||||
|
December |
July |
||||
|
Total CPI |
100.0 |
–0.5 |
0.0 |
0.3 |
0.3 |
|
Food products and non-alcoholic beverages |
25.2 |
–0.3 |
1.4 |
0.9 |
0.9 |
|
Alcoholic beverages and tobacco products |
7.7 |
0.4 |
3.3 |
4.0 |
2.9 |
|
Clothing and footwear |
7.0 |
–7.3 |
–8.5 |
0.5 |
–0.3 |
|
Housing, water, electricity, gas and other fuels |
14.1 |
–1.0 |
–1.8 |
-2.0 |
–0.6 |
|
Furnishings, household equipment and routine maintenance of the house |
4.9 |
–0.8 |
–1.1 |
-0.5 |
0.3 |
|
Health care |
6.2 |
0.6 |
1.8 |
1.1 |
1.1 |
|
Transport |
14.2 |
0.5 |
0.5 |
0.4 |
–1.1 |
|
Communications |
3.5 |
0.5 |
–2.8 |
-5.2 |
–7.1 |
|
Recreation and culture |
6.0 |
0.8 |
1.3 |
0.2 |
0.8 |
|
Education |
1.7 |
0.0 |
–0.1 |
1.2 |
1.4 |
|
Hotels, cafes and restaurants |
4.0 |
0.9 |
2.2 |
2.9 |
2.5 |
|
Miscellaneous goods and services |
5.5 |
0.3 |
0.3 |
0.5 |
1.0 |
1 COICOP – Classification of Individual Consumption by Purpose
Table 2. Largest influence on the overall change in consumer prices over the month (July 2014, against June by COICOP class of consumer goods and services
|
COICOP classes of consumer goods and services |
Relative share (weight) of consumption expenditure in total consumption expenditure,% |
Price growth, drop (–),% |
Influence, percentage points |
|
Passenger transport by air |
0.5 |
14.9 |
+0.077 |
|
Package holidays |
0.9 |
4.7 |
+0.042 |
|
Coffee, tea and cocoa |
1.0 |
4.1 |
+0.041 |
|
Restaurants and cafes |
2.4 |
1.2 |
+0.030 |
|
Non-hospital-based other medical services |
0.7 |
3.8 |
+0.028 |
|
Meat |
6.6 |
0.3 |
+0.020 |
|
|
|
|
|
|
Clothing |
4.4 |
–7.6 |
–0.325 |
|
Footwear |
2.4 |
–7.5 |
–0.176 |
|
Gas |
1.4 |
–9.4 |
–0.120 |
|
Vegetables |
1.9 |
–6.0 |
–0.116 |
|
Solid fuel |
1.9 |
–1.9 |
–0.040 |
|
Non-durable household goods |
2.0 |
–1.7 |
–0.034 |
The overall change in consumer prices is influenced not only by the size of the price change for a certain product but also by the relative share (weight) of expenditure on that product in the total consumption expenditure.
Concepts
Inflation is a decrease in the purchasing power of a currency unit, which manifests itself in a long-term increase in the average general price level.
Annual inflation shows the relative change in the average price level between the reporting month and the corresponding month of the previous year.
Average annual inflation shows the relative change in the average price level between the last twelve months and the corresponding previous twelve months.
More information on the issue is available in the Database of Indicators of Statistics Lithuania.


 «The Baltic Course» Is Sold and Stays in Business!
