
Analytics, Baltic States – CIS, Demography, EU – Baltic States, Latvia, Society
International Internet Magazine. Baltic States news & analytics
Tuesday, 23.04.2024, 15:25
22.6 thousand Latvian residents chose to emigrate in 2013
 Print version
According to the calculations made by the CSB during the time period from 2000 to 2013, 259 thousand people emigrated from Latvia and have not returned. At the beginning of 2014 there were 2 001 468 people permanently living in Latvia, which is 22.4 thousand less than in 2013.
Despite the fact that international long-term emigration decreased in 2013, also international long-term immigration declined – 22 561 persons emigrated from Latvia in 2013, which is 2.6 thousand less than in 2012; 8299 persons arrived in Latvia for permanent residence, which is by 5 thousand fewer than in 2012.
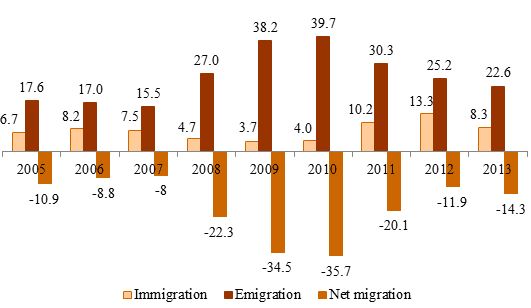 |
| International long-term migration from 2005 to 2013 (thsd.) |
The compiled data show that the most popular destination for emigration of Latvian residents are the countries of the European Union (EU) and countries of the Commonwealth of Independent States (CIS)2. In 2013 the share of the EU countries in the international emigration flow accounted for 73.1% (in 2012 – 81.5%), and in the immigration flow – for 57.8% (in 2012 – 54.9%); in turn, the share of CIS countries accounted for 16.6% and 31.0%, respectively.
International long-term migration in 2012 and 2013 by group of countries
|
|
2012 |
2013 |
||||
|
|
Immigration |
Emigration |
Net migration |
Immigration |
Emigration |
Net migration |
|
|
|
|
|
|
|
|
|
Total |
13 303 |
25 163 |
–11 860 |
8 299 |
22 561 |
–14 262 |
|
of which: |
|
|
|
|
|
|
|
EU countries |
7 299 |
20 503 |
–13 204 |
4 794 |
16 503 |
–11 709 |
|
CIS countries |
4 771 |
2 502 |
2 269 |
2 572 |
3 741 |
–1 169 |
|
Other countries |
1 233 |
2 158 |
-925 |
933 |
2 317 |
–1 384 |
In 2013, 92.7% of international emigrants were Latvian nationals (citizens of Latvia – 84.9%, non-citizens of Latvia – 7.8%); in turn, 2.1% of emigrants were citizens of other EU countries. Latvian nationals accounted for 65% of the total number of immigrants: 57.5% of them were citizens of Latvia, and 7.4% – non-citizens.
Analysing by ethnic composition Latvians accounted for 10.8 thousand or 47.8% of the total number of emigrants, and Russians – for 7.1 thousand or 31.3%. In turn, there were 3.1 thousand Latvians among immigrants, which accounts for 37.1% of the total number of immigrants, while Russians accounted for 2.5 thousand or 29.8%. At the beginning of 2014 Latvian emigrants accounted for 0.9% of the total number of Latvians, and Russian emigrants comprised 1.3% of the total number of Russians. Due to migration the number of Russians decreased more rapidly as compared to the number of Latvians: the number of Latvians decreased by 0.6%, and the number of Russians – by 0.9%.
The largest share of emigrants – 18.7 thousand or 82.8% was residents at working age (15 to 61 years of age); in 2012 this indicator was 81.3%. It should be pointed out that almost 23% of emigrants at working age or 4.3. thousand were young people aged 15 – 24, and this number is not decreasing (in 2012, 4.2 thousand young people aged 15 – 24 left the country).
Out of the total number of immigrants 6.4 thousand or 77.4% were people at working age (15 – 61 years of age), of which 864 or 13.4% were 15 – 24 years old.
According to the compiled information there were 2.9 time more emigrants at working age (15- 61) than immigrants, while the number of emigrants aged 15 – 24 were even five time more than immigrants (in 2012, 1.8 and 2.7 times respectively).
International long-term migration in 2013 by age of migrants
|
|
Total |
of which |
share in the total number of immigrants/emigrants |
||||
|
under working age (0-14 years) |
at working age (15-61 year) |
over working age (62 years and over) |
under working age (0-14 years) |
at working age (15-61 year) |
over working age (62 years and over) |
||
|
|
|
|
|
|
|
|
|
|
Immigration |
|||||||
|
2012 |
13 303 |
1 341 |
11 140 |
822 |
10.1 |
83.7 |
6,2 |
|
2013 |
8 299 |
1 311 |
6 422 |
566 |
15.8 |
77.4 |
6.8 |
|
Emigration |
|||||||
|
2012 |
25 163 |
3 593 |
20 461 |
1 109 |
14.3 |
81.3 |
4.4 |
|
2013 |
22 561 |
2 925 |
18 689 |
947 |
13.0 |
82.8 |
4.2 |
Analysis of territorial distribution of migration shows that 44.8% of international long-term immigrants chose Riga as their place of residence, while residents of Riga account for 32.8% of the total number of international emigrants. 16.6% of international immigrants resided in Pierīga region, while 15.2% of emigrants came from this region. The number of population due to international long-term migration decreased most in Riga and Kurzeme region – by 3.7 and 2.6 thousand respectively. However, analysing by the share of population in the total number of population at the beginning of 2013, the number of population due to migration decreased most in Kurzeme and Latgale region – by 1.0% and 0.9%, respectively.
International long-term migration by region in 2013
|
|
Immigration |
Emigration |
Net migration |
|
|
number |
% of total population on 01.01.2013 |
|||
|
Total |
8 299 |
22 561 |
–14 262 |
–0.7 |
|
Riga |
3 715 |
7 400 |
–3 685 |
–0.6 |
|
Pierīga |
1 376 |
3 439 |
–2 063 |
–0.6 |
|
Vidzeme |
582 |
2 255 |
–1 673 |
–0.8 |
|
Kurzeme |
870 |
3 448 |
–2 578 |
–1.0 |
|
Zemgale |
789 |
2 522 |
–1 733 |
–0.7 |
|
Latgale |
967 |
3 497 |
–2 530 |
–0.9 |
Due to internal migration the number of residents of Riga increased by 1725 persons in 2013. Also some Pierīga counties witnessed positive internal net migration in 2013: Ikšķile county (+165 persons), Mārupe county (+110 persons), Ādaži county (+89 persons), Babīte county (+75 persons), and Carnikava county (+3 persons); also Kurzeme region Mērsrags county (+5 persons).
In accordance with the provisional information compiled and published by the Statistical Office of the European (Eurostat) on the changes of the number of population due to migration, the highest positive net migration rate in Europe per 1000 residents was recorded in Luxembourg (+19.0), Malta (+7.6), Sweden (+6.8), and Austria (+6.5). In turn, the highest negative net migration rate per 1000 residents was registered in Cyprus (-13.9), Latvia (-7.1), Lithuania (-5.7), Ireland (-5.6), Spain (-4.7), and Greece (-4.7)3.
Calculation of the number of population and international long-term migration is based on methodology for population number estimates developed by the CSB in 2012. At the beginning of the year status of the actual place of residence is evaluated for each person registered in Latvia. Logic regression pattern is developed for this purpose. Carrying out the evaluation, a wide choice of administrative data at personal level, as well as data of other countries on international long-term immigration from Latvia are analysed. Quality of the information prepared is evaluated using data of surveys organised by the CSB, information compiled by local governments on benefits granted, as well as other information at personal level.
Information on the number of population in administrative territories at the beginning of 2014 and changes in 2013, as well as data on key demographic indicators are available in the CSB database. Detailed evaluation of the number of population is also available on the CSB homepage in methodology description.
1International long-term migration – movement of the population from one country to another with an aim to change the place of residence permanently or for a period of at least one year.
2Members of Commonwealth of Independent States (CIS): Armenia, Azerbaijan, Belarus, Kazakhstan, Kyrgyzstan, Moldova, Russia, Tajikistan, Turkmenistan, Ukraine, Uzbekistan
3Eurostat. EU28 population 507.4 million at 1 January 2014. Aivalable: http://epp.eurostat.ec.europa.eu/cache/ITY_PUBLIC/3-10072014-BP/EN/3-100...


 «The Baltic Course» Is Sold and Stays in Business!
