
Analytics, Baltic Export, Baltic States – CIS, EU – Baltic States, Foreign trade , Latvia
International Internet Magazine. Baltic States news & analytics
Thursday, 25.04.2024, 10:06
In May, exports in Latvia reduced by 3.6%, imports – by 5%
 Print version
In April foreign trade balance slightly improved as exports in total foreign trade value increased to 45.0% (in April 2014 – 44.7%).
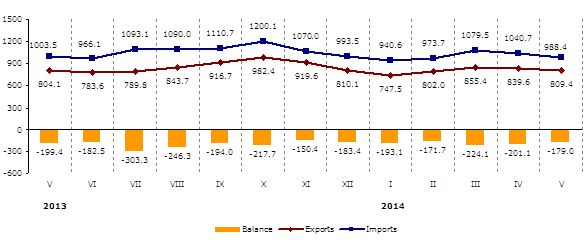 |
| Latvia’s foreign trade, in mln euros (1) |
In May, compared to April, exports to Russia decreased by 14.0 mln euros or 16.5%. Prepared foodstuffs experienced the largest drop – of 3.3 mln euros or 13.1%, vegetable products – of 2.7 mln euros or 61.4%, products of the chemical and allied industries – of 2.4 mln euros or 26.6%. But imports reduced by 20.5 mln euros or 23.7%, of which of transport vehicles and associated transport equipment – by 9.2 mln euros or 93.0% and of mineral products – by 5.2 mln euros or 14.6%.
In the result Russia's share in exports of Latvia in May reduced to 8.7% (10.1% in April), but in imports – to 6.7% (8.3% in April).
Main changes in exports in May, compared to April:
- exports of vegetable products dropped by 21.7 mln euros or 56.3%,
- exports of mineral products decreased by 9.4 mln euros or 12.5%,
- exports of machinery and mechanical appliances; electrical equipment fell by 8.5 mln euros or 6.3%,
- exports of prepared foodstuffs reduced by 6.3 mln euros or 9.0%,
- exports of basic metals and articles of basic metals grew by 15.0 mln euros or 17.1%.
Main changes in imports in May, compared to April:
- imports of machinery and mechanical appliances; electrical equipment fell by 15.2 mln euros or 7.8%,
- imports of mineral products decreased by 9.2 mln euros or 6.1%,
- imports of plastics and articles thereof dropped by 7.3 mln euros or 11.9%,
- imports of vegetable products reduced by 6.7 mln euros or 14.9%,
- imports of vehicles, aircraft, vessels and associated transport equipment increased by 3.7 mln euros or 5.5%.
Foreign trade of Latvia by country groups in May 2014, at current prices
|
|
Exports |
Imports |
||||
|
|
mln euros |
% of total |
In % (+, –) over April 2014 |
mln euros |
% of total |
In % (+, –) over April 2014 |
|
Total |
809.4 |
100 |
-3.6 |
988.4 |
100 |
-5.0 |
|
Member States of the European Union |
595.2 |
73.5 |
-2.9 |
805.4 |
81.5 |
-2.3 |
|
Euro area countries |
256.5 |
31.7 |
-3.6 |
406.9 |
41.2 |
-0.4 |
|
CIS countries |
108.8 |
13.4 |
-9.3 |
110.1 |
11.1 |
-15.4 |
|
Other countries |
105.5 |
13.0 |
-0.9 |
72.9 |
7.4 |
-15.3 |
In May main export partners were Lithuania (17.9% of total export), Estonia (12.3%), Germany (7.2%) and Poland (6.8%), but main import partners were Lithuania (18.1% of total import), Germany (11.3%), Poland (11.2%) and Estonia (8.1%).
Changes of main commodities in Latvia’s export in May 2014, at current prices
|
|
thsd euros |
% of total |
% (+, –) over |
||
|
May 2013 |
April 2014 |
average of previous 12 months |
|||
|
Total |
809 442 |
100 |
+0.7 |
-3.6 |
-3.8 |
|
wood and wood products; wood charcoal |
153 224 |
18.9 |
+6.3 |
+0.9 |
+10.3 |
|
electrical machinery and equipment |
86 930 |
10.7 |
-3.4 |
-5.8 |
-0.4 |
|
mineral fuels, mineral oils and products of their distillation |
60 010 |
7.4 |
-9.9 |
-14.6 |
-12.4 |
|
iron and steel |
52 046 |
6.4 |
+48.1 |
+37.2 |
+64.8 |
|
machinery and mechanical appliances |
39 820 |
4.9 |
-8.3 |
-7.3 |
-9.5 |
|
articles of iron and steel |
31 519 |
3.9 |
+23.0 |
+12.3 |
+15.9 |
|
pharmaceutical products |
30 652 |
3.8 |
+35.1 |
+33.5 |
+19.3 |
|
vehicles other than railway or tramway rolling stock, and parts and accessories thereof |
29 855 |
3.7 |
-0.5 |
+6.7 |
+0.6 |
|
beverages, spirits and vinegar |
27 118 |
3.4 |
-26.7 |
-17.7 |
-35.4 |
|
plastics and articles thereof |
21 795 |
2.7 |
+3.5 |
+5.0 |
+12.6 |
Rise of exports of iron and steel in May 2014, as compared to May 2013, was mostly affected by the increase in exports of waste and scrap of cast iron of 17.0 mln euros or 2.5 times. But exports of beverages, spirits and vinegar reduced rapidly as exports of spirits dropped by 8.6 mln euros or 31.8%.
Changes of main commodities in Latvia’s import in May 2014, at current prices
|
|
thsd euros |
% of total |
% (+, –) over |
||
|
May 2013 |
April 2014 |
average of previous 12 months |
|||
|
Total |
988 438 |
100 |
-1.5 |
-5.0 |
-5.6 |
|
mineral fuels, mineral oils and products of their distillation |
136 041 |
13.8 |
-8.3 |
-6.2 |
-16.0 |
|
electrical machinery and equipment |
101 753 |
10.3 |
+5.4 |
-6.2 |
-1.8 |
|
machinery and mechanical appliances |
78 690 |
8.0 |
-19.5 |
-9.7 |
-14.6 |
|
vehicles other than railway or tramway rolling stock, and parts and accessories thereof |
60 833 |
6.2 |
-16.2 |
+15.2 |
-12.2 |
|
pharmaceutical products |
53 789 |
5.4 |
+38.8 |
+26.1 |
+30.9 |
|
plastics and articles thereof |
41 750 |
4.2 |
-11.9 |
-5.1 |
-0.2 |
|
iron and steel |
34 617 |
3.5 |
+11.0 |
-8.7 |
-6.4 |
Rise of imports of pharmaceutical products in May 2014, as compared to May 2013, was mostly affected by the increase in imports of pharmaceutical products by 7.8 mln euros or 25.7%. But decrease of imports of machinery and mechanical appliances was affected by fall in imports of excavators and similar machinery by 3.7 mln euros or 82.6%.
More information on Latvia’s foreign trade by months and quarters by country groups and commodity groups can be obtained in the CSB data base section „Foreign trade” Short term statistical data.
1 Data on 2013 and February 2014 have been revised.


 «The Baltic Course» Is Sold and Stays in Business!
