
Analytics, Inflation, Latvia, Markets and Companies
International Internet Magazine. Baltic States news & analytics
Friday, 19.04.2024, 21:52
Annual inflation in Latvia made by 0.7% in June
 Print version
Compared to the previous 12 months, the average consumer price level over the last 12 months2) increased by 0.2%.
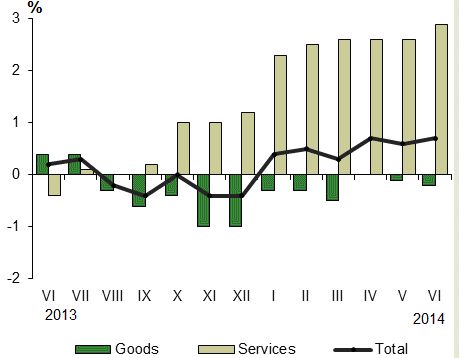 |
| Changes in consumer prices in 2013 and 2014
(% over corresponding month of the previous year) |
The greatest pressure on the average level of consumer prices in June 2014, as compared to June 2013, was put by increase in prices of alcoholic beverages and tobacco, hotel and restaurant services, transport goods and services, individual care goods and services, as well as by price drop for food and communication services.
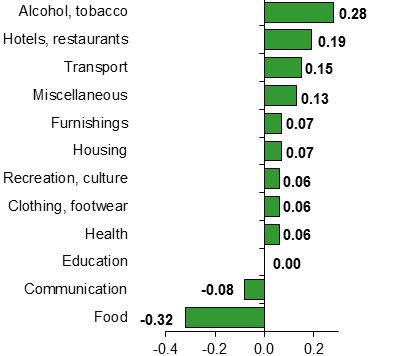 |
| Commodity group impact on Consumer Price Index
over the last 12 months (percentage points) |
The average food price level in June 2014 as compared to the corresponding month of the previous year decreased by 1.3%. A significant price drop in June was recorded in prices of vegetables and potatoes, which was affected by a rapid price growth in the summer of 2013. A drop was also recorded in prices of tea and coffee, fruit, sugar, as well as in prices of juices and soft drinks. In turn, the most significant price growth was recorded for milk, cheese, eggs, meat and meat products, as well as for confectionery and honey.
Prices of alcoholic beverages grew by 1.2%, and prices of tobacco rose by 7.8%.
Prices in the transport group increased by 1.1%, which was affected by price growth for maintenance and repair services of personal transport equipment, motor cars, as well as for passenger transport by sea.
During the year prices of communication services decreased by 2.0% due to drop in the prices of internet access provision services and telecommunication equipment.
As compared to June 2013, prices of hotel and restaurant services rose by 4.7% as prices in cafés and restaurants grew by 5.6%, in canteens – by 3.4%, and prices on accommodation services increased by 3.2%.
Prices of hairdresser services grew on average by 5.4%.
Among other consumption groups the largest price increase was recorded for maintenance charges in multi-occupied buildings, footwear, while prices of heat energy decreased.
As compared to the previous month, consumer prices in June 2014 rose by 0.3%. The average level of prices of goods increased by 0.2%, and of services – by 0.6%.
The greatest pressures on the consumer prices during the month were put by growth in prices of food and non-alcoholic beverages, transport, alcoholic beverages and tobacco, as well as by drop in the prices of clothing and footwear.
Prices of food increased by 0.6%. Seasonally, prices of vegetables and potatoes increased on average by 1.9%. Growth was also recorded in prices of meat and meat products (+0.7%), eggs (+3.9%), milk and dairy products (+0.6%), sugar (+3.8%); in turn a drop was observed in prices of oils and fats (-1.3%).
Prices of tobacco products grew by 2.7%, which was affected by the law on excise duty. Price of beer as compared to June of the previous year increased by 1.6%. In turn, prices of wine dropped by 2.1%.
With the beginning of sales campaigns, prices of footwear declined by 6.9% and of clothing –by 1.2%.
Price growth was recorded for passenger transport by sea (+19.3%), maintenance and repair services of personal transport equipment (+1.2%) and purchase of motor cars (+1.0%). Price of fuels for transport increased by 0.3%, which was affected by growth in prices of petrol, while the average price level of diesel did not change and prices of liquid petroleum gas decreased.
Among other consumption groups, the most significant increase was recorded in prices of package holidays and non-durable household goods. In turn, drop was recorded in prices of cut flowers and books.
Consumer price changes by commodity group, %
|
Commodity group |
Price changes in June 2014, compared to: |
||
|
June 2013 |
December 2013 |
May 2014 |
|
|
Total |
0.7 |
1.6 |
0.3 |
|
Food |
-1.3 |
2.1 |
0.6 |
|
Alcohol, tobacco |
3.5 |
4.3 |
1.2 |
|
Clothing, footwear |
1.0 |
3.4 |
-3.1 |
|
Housing |
0.4 |
0.5 |
0.0 |
|
Furnishings |
1.6 |
1.9 |
1.1 |
|
Health |
1.1 |
0.6 |
0.5 |
|
Transport |
1.1 |
0.7 |
0.8 |
|
Communication |
-2.0 |
-0.8 |
-0.1 |
|
Recreation, culture |
0.8 |
1.3 |
0.1 |
|
Education |
0.2 |
-0.1 |
0.0 |
|
Hotels, restaurants |
4.7 |
3.5 |
0.4 |
|
Miscellaneous |
2.4 |
1.3 |
0.6 |
Sub-indices having the greatest impacts, percentage points
|
During a month |
||
|
Tobacco |
+0.08 |
|
Package holidays |
+0.05 |
|
Non-durable household goods |
+0.05 |
|
Vegetables and patatoes |
+0.04 |
|
Meat and meat products |
+0.04 |
|
Garden products and flowers |
-0.03 |
|
Clothing |
-0.05 |
|
Footwear |
-0.13 |
|
During 12 months |
|
|
Milk, cheese, eggs |
+0.27 |
|
Tobacco |
+0.21 |
|
Cafés and restaurants |
+0.12 |
|
Other house maintenance services |
+0.11 |
|
Footwear |
+0.11 |
|
Tea, coffee |
-0.11 |
|
Heat energy |
-0.20 |
|
Vegetables and patatoes |
-0.37 |
Information on Consumer Price Index in July 2014 will be published on August 8.
More detailed information on consumer price changes is available in the CSB database.
1 The annual measure of inflation that
is used to compare average monthly price level with the average price level in
the corresponding month of the previous year.
2 The average annual
measure of inflation that is used to compare the average price level of the
last 12 months with the average price level in 12 months of the previous year.


 «The Baltic Course» Is Sold and Stays in Business!
