
Analytics, Economics, GDP, Latvia, Markets and Companies
International Internet Magazine. Baltic States news & analytics
Wednesday, 24.04.2024, 14:34
In Q1, GDP in Latvia grew by 2.8%
 Print version
According to seasonally non-adjusted data, in the 1st quarter of 2014, compared to the 1st quarter of 2013, GDP at constant prices has grown by 2.8%, but, according to seasonally adjusted data, compared to the 4th quarter of 2013, it has increased by 0.6%.
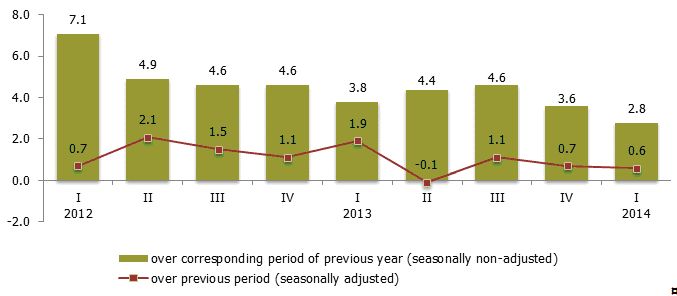
Changes of GDP volume, 1st quarter 2012 - 1st quarter 2014 (at constant prices, %)
Production approach
In the 1st quarter of 2014, as compared to the 1st quarter of 2013, manufacturing rate has grown by 1.2%, which was affected by 7.5% increase in manufacture of food products (21.1% of total manufacturing) and 7.6% increase in manufacture of wood and of products of wood (23.4% of total manufacturing). Manufacture of beverages has reduced by 4.9% (1.9% of total manufacturing) and manufacture of wearing apparel – by 15.4% (3.7% of total manufacturing). Manufacture of basic metals has decreased by 80.9%.
Construction has gone up by 24.6%. Construction of residential buildings has grown by 44.3% (16.9% of total construction), construction of main pipelines, communication and power lines – by 11.8% (7.7% of total construction), construction of administrative buildings – by 97.4% (7.5% of total construction) and construction of hotels and similar buildings – by 84.3%. Construction of highways, streets, roads, airfield runways, railways witnessed drop of 4.8% (6.1% of total construction) and construction of bridges and tunnels – of 19.4% (2.1% of total construction).
Trade rose by 2.5%, of which retail trade – by 2.6%, which formed 2.8% increase in trade of food products and 2.5% increase – of non-food products.
In commercial services sector the largest increase was observed among the following services: in architectural, engineering and inspection services and analysis – by 12.9%, in travel agencies – by 3.2%, in hairdressing and other beauty treatment – by 9.5%, as well as in repair of other personal goods – by 25.2%.
Rise in entertainment and recreation sector comprised 20.1%, but in gambling and betting sector – 12.6%.
Taxes on products (Value Added Tax, Excise Duty, customs duties) were collected by 1.7% more.
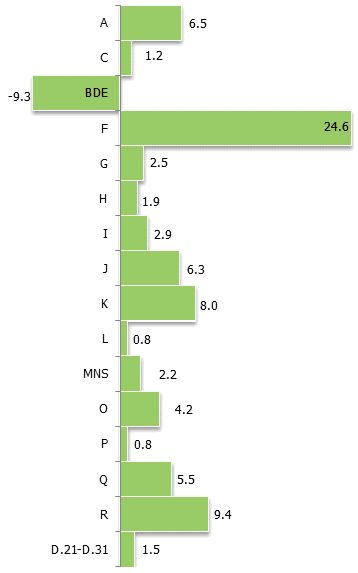 |
| Changes of GDP in the 1st quarter of 2014 by kind of economic activity, at constant prices, % over 1st quarter of 2013 |
|
NACE Rev. 2 activities |
||
|
agriculture, forestry and fishing (A); |
4.9 |
Structure of activities at current prices, % |
|
manufacturing (C); |
13.9 |
|
|
other industry (BDE); |
5.8 |
|
|
construction (F); |
4.0 |
|
|
trade (G); |
15.4 |
|
|
transportation and storage (H); |
11.8 |
|
|
accommodation and food service activities (I); |
1.7 |
|
|
information and communication (J); |
4.7 |
|
|
financial and insurance activities (K); |
3.6 |
|
|
real estate activities (L); |
11.5 |
|
|
commercial services (MNS); |
7.0 |
|
|
public administration and defence; compulsory social security (O); |
6.8 |
|
|
education (P); |
3.9 |
|
|
human health and social work activities (Q); |
3.1 |
|
|
arts, entertainment and recreation (R); |
1.9 |
|
|
(D.21-D.31) taxes on products minus subsidies on products |
x |
|
Expenditure approach
In the 1st quarter of 2014, compared to the 1st quarter of 2013, private final consumption at current prices grew by 2.5%. Rise was observed within two main groups of consumption expenditure: food (20% of total expenditure) – of 3.1% and transport (14% of total expenditure) – of 1.9%. Households' expenditure on housing due to the warm weather has reduced by 2.5% (27% of total expenditure). Gross fixed capital formation increased by 2.8%. Export of goods (72% of total exports) has risen by 0.4%, but exports of services – by 4.3%. Volume of imports of goods (86% of total imports) has reduced by 1.9%, but imports of services – by 2.4%.
 |
| Gross domestic product by main expenditure items |
Compared to the 1st quarter of 2013, private final consumption in the 1st quarter of 2014 at constant prices grew by 2.1%, of which expenditure on food – by 2.7%, but expenditure on transport – rose by 3.6%. But expenditure on housing decreased by 3.4%.
Expenditure on gross fixed capital formation increased by 2.2%. Volume of investment in the manufacturing has grown by 34.2%, but electricity, gas, steam and air conditioning supply experienced significant decrease of volume of investment – 33.4%.
Export of goods increased by 1.7%, but export of services – by 3.6%. In its turn, import of goods decreased by 1.3%, while import of services – by 3.6%.
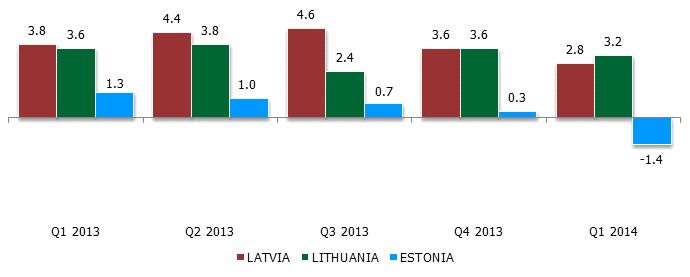 |
| Changes of Gross Domestic Product in the Baltic Countries (at constant prices, % of the corresponding period of the previous year) |
In September of this year GDP will be published accordingly new methodology of national system of accounts – European System of Accounts ESA 2010.


 «The Baltic Course» Is Sold and Stays in Business!
