
Analytics, Employment, Financial Services, GDP, Labour-market, Lithuania, Markets and Companies
International Internet Magazine. Baltic States news & analytics
Thursday, 25.04.2024, 21:05
The gross value added per person employed amounted to LTL 83 447 in 2013
 Print version
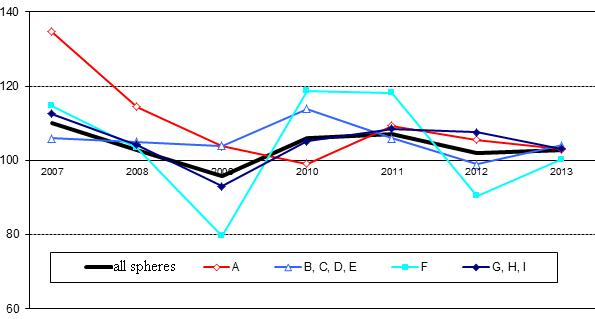
In 2013, the highest labour productivity – LTL 86.5 per hour actually worked – was recorded in real estate enterprises, although a downward trend has been observed. The labour productivity of financial and insurance enterprises (LTL 80.6 per hour actually worked) exceeded the labour productivity in the whole economy almost twice.
Labour productivity was also rather high in information and communication (LTL 74.4), industrial (LTL 59.6; manufacturing – LTL 57.9), and wholesale and retail trade, transportation, accommodation and food service (LTL 54.5) enterprises. The lowest labour productivity (LTL 20.1) was observed in enterprises engaged in agriculture, forestry and fishing.
At constant prices, in 2013, compared to 2012, the gross value added per hour actually worked grew by 2.8%, per person employed – by 1.9%.
Table 1. Gross value added per hour actually worked, at current prices, LTL
|
|
2007 |
2008 |
2009 |
2010 |
2011 |
2012 |
2013 |
|
Whole economy |
32.3 |
36.4 |
33.8 |
36.6 |
41.3 |
43.4 |
45.3 |
|
Agriculture, forestry and fishing (A) |
13.7 |
16.3 |
10.6 |
13.6 |
17.9 |
18.8 |
20.1 |
|
Industry (B, C, D, E) |
34.5 |
39.3 |
39.3 |
47.7 |
55.7 |
57.6 |
59.6 |
|
Manufacturing (C) |
31.9 |
37.2 |
35.8 |
44.1 |
52.9 |
55.2 |
57.9 |
|
Construction (F) |
31.8 |
36.3 |
25.9 |
30.2 |
37.1 |
34.8 |
36.3 |
|
Wholesale and retail trade;
transport; |
33.5 |
38.1 |
37.1 |
40.8 |
45.9 |
51.7 |
54.5 |
|
Information and communication (J) |
70.6 |
72.3 |
71.8 |
75.4 |
64.0 |
60.3 |
74.4 |
|
Financial and insurance activities (K) |
75.4 |
97.3 |
48.6 |
57.8 |
78.0 |
71.1 |
80.6 |
|
Real estate activities (L) |
111.1 |
130.6 |
110.8 |
92.3 |
103.9 |
97.1 |
86.5 |
|
Professional, scientific and
technical activities; |
40.7 |
37.2 |
34.8 |
31.2 |
34.7 |
35.2 |
35.4 |
|
Public administration and
defence; |
21.3 |
25.2 |
26.2 |
24.6 |
26.3 |
27.5 |
28.5 |
|
Arts, entertainment and recreation,
repair |
22.0 |
17.5 |
18.2 |
19.0 |
19.5 |
20.3 |
20.2 |
 |
| Labour productivity indices calculated based on the value added created per hour actually worked (1), compared with the previous year, % |
Table 2. Labour productivity changes based on gross value added per hour actually worked (1), compared to the previous year, %
|
|
2007 |
2008 |
2009 |
2010 |
2011 |
2012 |
2013 |
|
Whole economy |
10.2 |
2.7 |
-4.3 |
6.1 |
7.0 |
1.9 |
2.8 |
|
Agriculture, forestry and fishing (A) |
34.7 |
14.4 |
3.7 |
-0.9 |
9.3 |
5.5 |
3.0 |
|
Industry (B, C, D, E) |
5.9 |
5.0 |
3.9 |
13.8 |
5.9 |
-1.0 |
4.0 |
|
Manufacturing (C) |
6.9 |
7.1 |
1.8 |
15.3 |
8.8 |
0.9 |
6.3 |
|
Construction (F) |
14.7 |
3.3 |
-20.4 |
18.8 |
18.2 |
-9.6 |
0.3 |
|
Wholesale and retail trade;
transport; |
12.6 |
4.2 |
-7.0 |
5.1 |
8.5 |
7.5 |
3.2 |
|
Information and communication (J) |
-6.3 |
2.7 |
3.1 |
11.1 |
-14.3 |
-9.1 |
20.4 |
|
Financial and insurance activities (K) |
-16.6 |
20.4 |
-19.3 |
9.3 |
26.6 |
1.1 |
7.6 |
|
Real estate activities (L) |
27.0 |
10.4 |
-8.1 |
-12.8 |
7.9 |
-9.1 |
-11.1 |
|
Professional, scientific and
technical activities; |
36.1 |
-14.0 |
-14.9 |
-7.0 |
6.5 |
-1.5 |
-1.2 |
|
Public administration and
defence; |
-1.2 |
-0.6 |
2.8 |
-0.9 |
3.9 |
3.3 |
1.8 |
|
Arts, entertainment and
recreation, repair |
-1.7 |
-30.9 |
-11.6 |
5.3 |
-0.6 |
1.9 |
-2.1 |
__________________
1 Labour productivity
indices calculated based on the values of the gross value added estimated using
a chain-linking method.
Table 3. Gross value added per person employed, at current prices, LTL thousand
|
|
2007 |
2008 |
2009 |
2010 |
2011 |
2012 |
2013 |
|
Whole economy |
61.6 |
70.4 |
63.0 |
68.9 |
76.7 |
80.5 |
83.4 |
|
Agriculture, forestry and fishing (A) |
23.5 |
32.0 |
19.6 |
25.6 |
34.4 |
36.4 |
38.0 |
|
Industry (B, C, D, E) |
69.7 |
76.6 |
73.9 |
91.9 |
106.7 |
111.8 |
114.9 |
|
Manufacturing (C) |
65.1 |
72.2 |
66.9 |
84.6 |
101.1 |
106.8 |
111.0 |
|
Construction (F) |
61.4 |
73.0 |
48.5 |
58.2 |
73.5 |
68.6 |
71.2 |
|
Wholesale and retail trade;
transport; |
66.6 |
75.1 |
70.7 |
78.9 |
87.1 |
96.8 |
100.8 |
|
Information and communication (J) |
152.6 |
138.5 |
142.0 |
141.6 |
116.7 |
113.1 |
136.6 |
|
Financial and insurance activities (K) |
138.1 |
174.2 |
92.5 |
109.8 |
146.4 |
125.6 |
140.8 |
|
Real estate activities (L) |
206.7 |
248.1 |
210.1 |
172.0 |
181.8 |
182.4 |
156.0 |
|
Professional, scientific and
technical activities; |
75.9 |
72.0 |
65.3 |
58.4 |
61.9 |
64.1 |
63.9 |
|
Public administration and
defence; |
38.1 |
46.6 |
46.9 |
44.3 |
46.3 |
48.0 |
49.9 |
|
Arts, entertainment and
recreation, repair |
40.4 |
32.5 |
33.5 |
34.6 |
34.6 |
35.2 |
34.2 |
Table 4. Labour productivity changes based on gross value added per person employed, compared to the previous year, %
|
|
2007 |
2008 |
2009 |
2010 |
2011 |
2012 |
2013 |
|
Whole economy |
13.0 |
4.3 |
-7.8 |
7.3 |
5.5 |
1.9 |
1.9 |
|
Agriculture, forestry and fishing (A) |
37.3 |
31.0 |
-1.6 |
0.0 |
12.0 |
6.0 |
1.0 |
|
Industry (B, C, D, E) |
8.8 |
1.3 |
0.1 |
16.6 |
5.5 |
0.2 |
3.3 |
|
Manufacturing (C) |
10.0 |
2.0 |
-2.0 |
18.4 |
8.3 |
2.3 |
5.3 |
|
Construction (F) |
16.1 |
7.6 |
-25.9 |
22.3 |
21.6 |
-10.1 |
-0.2 |
|
Wholesale and retail trade;
transport; |
14.5 |
3.3 |
-10.0 |
6.7 |
6.2 |
6.3 |
1.9 |
|
Information and communication (J) |
0.2 |
-9.0 |
6.4 |
5.5 |
-16.9 |
-6.5 |
17.8 |
|
Financial and insurance activities (K) |
-16.9 |
17.5 |
-14.2 |
9.0 |
25.4 |
-4.8 |
6.3 |
|
Real estate activities (L) |
28.8 |
12.7 |
-8.3 |
-14.3 |
1.4 |
-2.5 |
-14.6 |
|
Professional, scientific and
technical activities; |
38.2 |
-10.6 |
-17.7 |
-7.0 |
1.5 |
0.5 |
-2.1 |
|
Public administration and
defence; |
2.7 |
3.1 |
-0.7 |
-0.3 |
1.4 |
2.6 |
2.1 |
|
Arts, entertainment and recreation,
repair |
0.7 |
-30.0 |
-12.5 |
4.0 |
-2.8 |
-0.5 |
-4.7 |
The number of persons employed and hours worked for 2007–2013 has been revised based on the population figures recalculated on the basis of the results of the 2011 Population and Housing Census of the Republic of Lithuania.
Concepts
Employed population – persons doing any kind of work, for which they are remunerated in cash or in kind or have income or profit.


 «The Baltic Course» Is Sold and Stays in Business!
