
Analytics, Inflation, Lithuania, Markets and Companies
International Internet Magazine. Baltic States news & analytics
Friday, 19.04.2024, 16:15
In March, annual inflation in Lithuania stood at 0.2%
 Print version
It was mainly influenced by an increase in prices for clothing, footwear, fruit, as well as by a decrease in prices for vegetables, telephone and telefax services, heat energy (see Table 2).
Over the said period, prices for consumer goods increased by 0.4%, while prices for consumer services remained almost unchanged.
Prices for consumer goods and services regulated by State and municipal authorities remained almost unchanged. Market prices increased by 0.4%; the influence of the change in market prices stood at plus 0.358 percentage points.
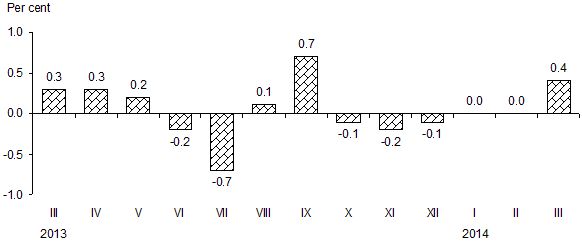 |
| Fig. 1. Monthly changes in prices for consumer goods and services, compared to the previous month |
In March 2014, against February, due to new collections, prices for clothing increased by 4.4, footwear – 5.7%. Prices for repair and rent of clothing increased by 1%.
As regards communication goods and services, the largest decrease in prices over the said period was observed for mobile phone communication services (1.9%).
As for food products and non-alcoholic beverages, the largest increase in prices was observed for fresh fruit – 5.2% (citrus fruit – 7.8, other fruit – 10.8%), margarine and coffee – 1.7% each. A decrease in prices was observed for potatoes – 7.5, chocolate – 3.1, fresh vegetables – 1.9, sugar – 2%.
In the group of health care goods and services, the largest increase in prices was observed for services of sanatoriums – 1.8, pharmaceuticals – 0.3%.
In the group of services of hotels, cafes and restaurants, the largest increase in prices was observed for hotel accommodation services (3%).
In March 2014, annual (March 2014, against March 2013) inflation stood at 0.2% and was by 1.3 percentage points lower than in March 2013 (in March 2013, against March 2012, inflation stood at 1.5%).
The annual inflation rate was mainly determined by an increase in prices for solid fuel – 23.4, milk, cheese and eggs – 5.8, tobacco products – 4.7, bread and cereal – 1.7, services of restaurants and cafes – 2.3, beer – 4.7%, as well as by a decrease in prices for telephone and telefax services – 9.3, heat energy – 6.8, fuels and lubricants – 2.5, electricity – 5.4, coffee, tea and cocoa – 7.2, gas – 5.3%.
Over the year, prices for consumer goods increased by 0.1, those for services – 0.4%.
In March 2014, compared to March 2013, prices for consumer goods and services regulated by State and municipal authorities decreased by 2.1%, while market prices increased by 0.6%.
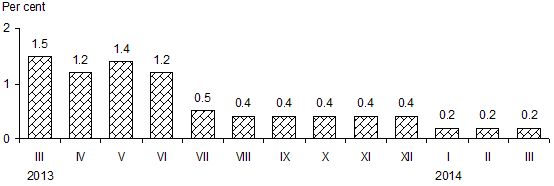 |
| Fig. 2. Annual changes in prices for consumer goods and services, compared with the corresponding month of the previous year |
In March 2014, average annual inflation stood at 0.6% and was by 2.1 percentage points lower than in March 2013 (2.7%).
Table 1. Changes in prices for consumer goods and services, March 2014, %
|
COICOP1 divisions of consumer goods and services |
Relative share (weight) of consumption expenditure in total consumption expenditure |
Price growth, drop (–) |
|||
|
March 2014, against |
average annual |
||||
|
February 2014 |
2013 |
||||
|
December |
March |
||||
|
Total CPI |
100.0 |
0.4 |
0.3 |
0.2 |
0.6 |
|
Food products and non-alcoholic beverages |
25.2 |
0.2 |
1.6 |
1.0 |
1.3 |
|
Alcoholic beverages and tobacco products |
7.7 |
0.1 |
1.4 |
2.6 |
2.4 |
|
Clothing and footwear |
7.0 |
4.9 |
–3.6 |
-0.2 |
0.1 |
|
Housing, water, electricity, gas and other fuels |
14.1 |
–0.1 |
0.7 |
0.3 |
–0.1 |
|
Furnishings, household equipment and routine maintenance of the house |
4.9 |
0.1 |
–0.3 |
–0.2 |
0.7 |
|
Health care |
6.2 |
0.3 |
0.5 |
1.1 |
1.4 |
|
Transport |
14.2 |
0.0 |
–0.1 |
–1.0 |
–1.3 |
|
Communications |
3.5 |
–1.0 |
–3.8 |
–9.1 |
–5.9 |
|
Recreation and culture |
6.0 |
–0.1 |
0.4 |
0.6 |
1.0 |
|
Education |
1.7 |
0.0 |
–0.2 |
1.0 |
2.5 |
|
Hotels, cafes and restaurants |
4.0 |
0.4 |
0.4 |
2.4 |
2.5 |
|
Miscellaneous goods and services |
5.5 |
0.0 |
–0.2 |
0.3 |
1.5 |
1 COICOP – Classification of Individual Consumption by Purpose
Table 2. Largest influence on the overall change in consumer prices over the month (March 2014, against February) by COICOP class of consumer goods and services
|
COICOP classes of consumer goods and services |
Relative share (weight) of consumption expenditure in total consumption expenditure, % |
Price growth, drop (–), % |
Influence, percentage points |
|
Clothing |
4.4 |
4.4 |
+0.176 |
|
Footwear |
2.4 |
5.7 |
+0.128 |
|
Fruit |
1.5 |
4.2 |
+0.066 |
|
Other articles of clothing and clothing accessories |
0.2 |
8.2 |
+0.016 |
|
Non-durable household goods |
2.0 |
0.8 |
+0.015 |
|
Passenger transport by air |
0.5 |
3.6 |
+0.014 |
|
|
|
|
|
|
Vegetables |
1.9 |
–2.5 |
–0.050 |
|
Telephone and telefax services |
3.3 |
–1.1 |
–0.035 |
|
Heat energy |
3.1 |
–0.8 |
–0.026 |
|
Transport of passengers by sea and on inland waters |
0.1 |
–29.9 |
–0.024 |
|
Fuels and lubricants |
7.1 |
–0.3 |
–0.023 |
|
Sugar, jams, honey, chocolate and confectionery |
1.6 |
–0.6 |
–0.011 |
The overall change in consumer prices is influenced not only by the size of the price change for a certain product but also by the relative share (weight) of expenditure on that product in the total consumption expenditure.
Concepts
Inflation is a decrease in the purchasing power of a currency unit, which manifests itself in a long-term increase in the average general price level.
Annual inflation shows the relative change in the average price level between the reporting month and the corresponding month of the previous year.
Average annual inflation shows the relative change in the average price level between the last twelve months and the corresponding previous twelve months.


 «The Baltic Course» Is Sold and Stays in Business!
