
Analytics, Estonia, Industry, Markets and Companies
International Internet Magazine. Baltic States news & analytics
Saturday, 20.04.2024, 07:27
In February industrial production in Estonia remained on the same level
 Print version
In February, the increase in manufacturing was 3% compared to February of the previous year. Among the branches of industry holding larger shares, production rose in the manufacture of wood, food products and electrical equipment. The volume of production fell in the manufacture of electronic and metal products.
In February, 71% of the whole production of manufacturing was sold on the external market. Export sales of manufacturing production fell 4% in February compared to the same month of the previous year, and domestic sales increased 3%. The decrease in exports was mainly caused by a decline in the sales of electronic, refined petroleum, chemical and metal products.
In February 2014, compared to January 2014, the seasonally adjusted total industrial production decreased 2%; production in manufacturing fell 1%.
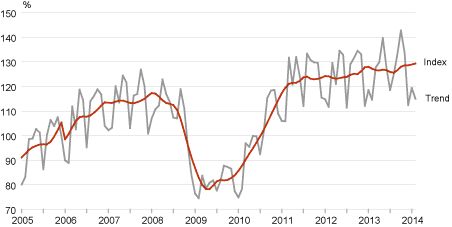 |
| The volume index and trend of production in manufacturing,
January 2005 – February 2014 (2010 = 100) |
Compared to February 2013, the production of electricity decreased by 18% and the production of heat decreased by 12%. The decrease in electricity production was mainly caused by the partial replacement of own production with imports.
Change in volume index of industrial production, February 2014 (percentages)
|
Economic activity |
Change compared to
the previous |
Change compared to
the corresponding |
|
|
according to |
according to workingday |
||
|
TOTAL |
-2.1 |
-2.3 |
0.1 |
|
Energy production |
-9.4 |
-16.0 |
-14.8 |
|
Mining |
3.4 |
-1.1 |
0.7 |
|
Manufacturing |
-0.9 |
0.4 |
3.2 |
|
manufacture of computer, electronic and optical products |
-1.0 |
-7.5 |
-4.6 |
|
manufacture of wood and wood products |
-1.3 |
3.1 |
5.6 |
|
manufacture of food products |
-2.3 |
3.8 |
5.6 |
|
manufacture of fabricated metal products |
-7.6 |
-11.2 |
-8.0 |
|
manufacture of electrical equipment |
4.8 |
8.2 |
12.2 |
|
manufacture of chemicals and chemical products |
11.5 |
-3.2 |
-0.1 |
|
manufacture of furniture |
-2.1 |
-3.8 |
-0.2 |
|
manufacture of motor vehicles |
-4.9 |
3.5 |
6.3 |
|
manufacture of building materials |
5.0 |
-3.1 |
-0.7 |
|
manufacture of machinery and equipment |
5.9 |
7.0 |
10.8 |
a In case of the seasonally adjusted volume index of industrial production, the impact of the differing number of working days in a month and seasonally recurring factors have been eliminated. It is calculated only in comparison with the previous period.
b In case of the working-day adjusted volume index of industrial production, the impact of the differing number of working days in a month has been eliminated. It is calculated only in comparison with the corresponding period of the previous year.


 «The Baltic Course» Is Sold and Stays in Business!
