
Analytics, Financial Services, Foodstuff, Latvia, Markets and Companies
International Internet Magazine. Baltic States news & analytics
Tuesday, 09.06.2026, 15:30
Household expenditure on food and non-alcoholic beverages grew by 7% in Latvia in 2011
 Print version
Data of the Household Budget Survey show that the average monthly household expenditure on food per one household member in 2011 comprised LVL 54 (in 2010 – LVL 50) or 28.8% of the total consumption expenditure (in 2010 – 28.3%). Household expenditure on food and non-alcoholic beverages grew by 7.0% as compared to 2010. In its turn, consumer prices for these products in 2011 increased by 8.4%.
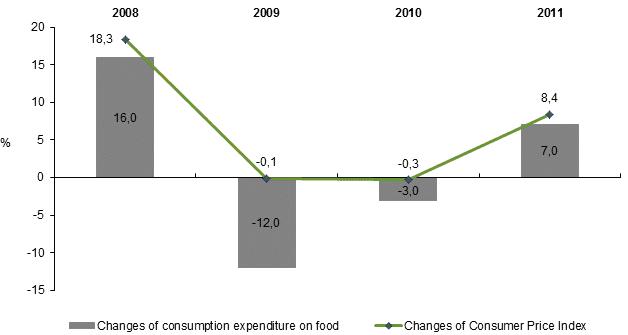 |
| Trend of household expenditure and Consumer Price Index of food and non-alcoholic beverages (at current prices) (as % of the previous year) |
Recalculating these expenditures to constant prices, expenditure on food and non-alcoholic beverages in fact has decreased by 1.3%. Besides, this decrease has been recorded several years in a row. Due to the limited financial resources, households try to save on food.
Consumer Price Index (CPI) for the majority of food products overtook the actual household consumption growth.
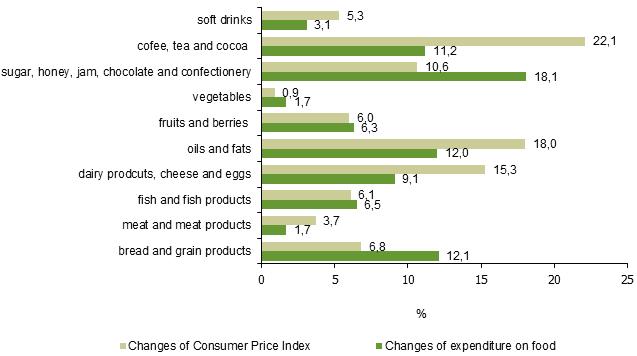 |
| Trend of household expenditure and Consumer Price Index of food and non-alcoholic beveragesby subgroup in 2011 (as % of the previous year) |
The most significant expenditure items of food basket in 2011 were meat and meat products, where the average monthly expenditure comprised LVL 12 per household member, milk and dairy products – LVL 8, bread and grain products – LVL 8 and on vegetables – LVL 7.
In accordance with the Household Budget Survey data, in 2011 one resident on average consumed 49 litres of milk, 14 kg of cheese and curd, 198 eggs, as well as 21 kg of fresh pork, 22 kg of sausages and smoked meat and 12 kg of fresh poultry. During the year one household member consumed 78 kg of potatoes and 23 kg of fresh tomatoes and cucumbers. The most popular fruit were apples (14 kg) followed by citrus fruit (9 kg) and bananas (6 kg). The annual consumption of fresh fish per one resident comprised 6 kg.
As compared to 2010 there were no significant changes recorded in consumption of the main groups of products in 2011. There was a slight decrease in consumption of pork, beef, whole milk and fermented milk products. Consumption of potatoes decreased significantly – by 9 kg, which could be explained with the rapid growth of CPI for potatoes in 2011 – by 35%. In its turn, in 2011 households consumed more poultry, all kinds of bread, pastry-cook products, milk with lower fat content, tomatoes, cucumbers, cabbages and fruit.
During the last decade, people tend to consume less bread, beef, whole milk, sugar and potatoes, while consuming more poultry, cheese, yoghurt, citrus fruit, cucurbits and legumes, as well as more mineral water and soft drinks.
Changes in consumption of selected food products (average per household member per year)
|
Food products |
All households |
||||
|
2002 |
2005 |
2008 |
2010 |
2011 |
|
|
Wheat bread (kg) |
27.8 |
23.7 |
18.9 |
17.1 |
17.3 |
|
Rye bread, fine rye-bread and other. kinds of bread (kg) |
35.1 |
31.5 |
26.3 |
22.9 |
23.9 |
|
Pastry-cook products (kg) |
4.5 |
5.8 |
6.6 |
4.8 |
5.5 |
|
Groats (kg) |
7.5 |
6.8 |
5.0 |
5.1 |
4.2 |
|
Beef, veal (kg) |
3.7 |
3.6 |
2.6 |
2.4 |
1.8 |
|
Pork (kg) |
17.3 |
21.4 |
21.7 |
22.1 |
20.8 |
|
Poultry (kg) |
7.6 |
9.5 |
10.0 |
11.0 |
11.6 |
|
Sausages, smoked meat (kg) |
22.4 |
25.3 |
25.4 |
22.0 |
22.2 |
|
Fresh, chilled or frozen fish (kg) |
8.9 |
7.0 |
6.6 |
6.0 |
6.0 |
|
Whole milk (l) |
52.0 |
47.6 |
44.0 |
37.8 |
36.6 |
|
Milk with lower fat content (l) |
14.5 |
11.0 |
7.5 |
11.8 |
12.2 |
|
Yoghurt (kg) |
3.6 |
5.7 |
7.5 |
6.7 |
6.4 |
|
Fermented milk products (l) |
12.2 |
11.5 |
11.1 |
12.8 |
11.5 |
|
Cheese, cottage cheese and curd (kg) |
12.4 |
12.6 |
14.0 |
13.8 |
13.9 |
|
Eggs (pieces) |
207 |
204 |
195 |
197 |
198 |
|
Apples, pears (kg) |
21.3 |
20.7 |
15.6 |
13.4 |
16.7 |
|
Fresh cabbages (kg) |
11.8 |
11.0 |
9.6 |
7.4 |
9.9 |
|
Fresh cucumbers (kg) |
12.0 |
11.2 |
9.3 |
10.1 |
10.9 |
|
Fresh tomatoes (kg) |
11.7 |
11.3 |
12.5 |
10.2 |
12.6 |
|
Potatoes (kg) |
115.7 |
102.7 |
82.0 |
87.1 |
78.3 |
|
Sugar (kg) |
20.7 |
19.3 |
17.0 |
14.5 |
14.2 |
Note: Table data reflect only consumption of food production at home.
Data of the Household Budget Survey show that in 2011 households increased their expenditure on public catering services. As compared to the previous year these expenditures grew by 19%. In 2011 households spent on average 4.2% of the total consumption expenditure for meals out (in 2010 – 3.7%). Despite the positive trend, still before the economic crisis households spent more both – for purchase of food products and for meals out.
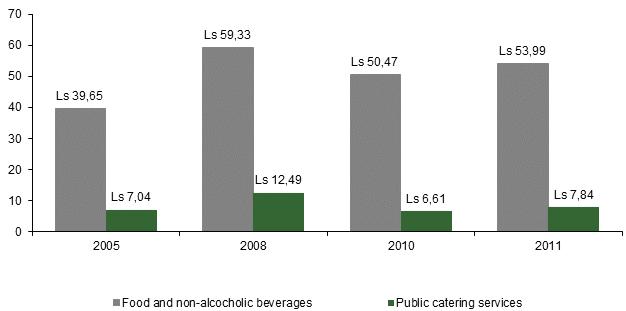 |
| Household expenditure on food and public catering services in 2011 (average per household member monthly, LVL) |
More detailed information on food consumption in households in 2011 will be available in the CSB home page at the end of the month.
[1] Consumption of products purchased, own-produced and received free-of-charge not taking into account the consumption of food in restaurants, canteens and other catering enterprises


 «The Baltic Course» Is Sold and Stays in Business!
