
Analytics, Economics, GDP, Lithuania, Markets and Companies
International Internet Magazine. Baltic States news & analytics
Tuesday, 09.06.2026, 10:11
GDP of Lithuania grew by 2.1% in Q2
 Print version
Over the first half-year, the gross domestic product created amounted to LTL 53 351 million at current prices, while the real GDP change, compared to the same period of the previous year, made up only 3%. In the first half-year, positive changes in gross value added have been observed in all groups of economic activities.
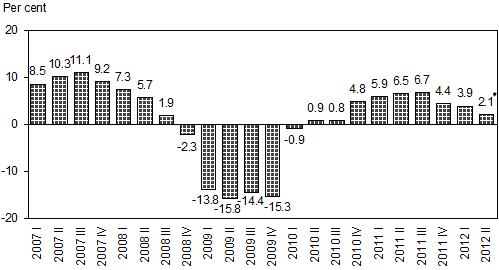 |
| Fig. 1. Changes in gross domestic product, compared to the corresponding period of the previous year |
♦ First gross domestic product estimate.
In II quarter 2012, GDP per capita amounted to LTL 8792 at current prices.
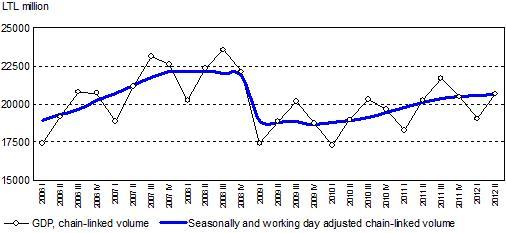 |
| Fig. 2. Changes in gross domestic product |
Statistics Lithuania, on the basis of more comprehensive data and estimation of the value added in accordance with a more detailed list of economic activities, has revised the second I quarter 2012 gross domestic product estimate. According to the revised data, in I quarter, the gross domestic product at current prices amounted to LTL 25 299 million and, against the same period in 2011, increased by 3.9% (the previously published second GDP estimate amounted to LTL 25 249 million, its change – 3.9%).
Gross domestic product and changes thereof
|
|
At current prices |
Changes in GDP,% |
|||
|
LTL million |
EUR million |
as compared to the previous quarter |
as compared to the corresponding quarter of the previous year |
as compared to the previous quarter, seasonally and working day adjusted,% |
|
|
2010◘ |
95074.3 |
27535.4 |
1.4 |
1.4 |
1.4 |
|
I |
21264.2 |
6158.5 |
-7.8 |
-0.9 |
0.5 |
|
II |
24078.9 |
6973.7 |
10.0 |
0.9 |
0.6 |
|
III |
25113.4 |
7273.4 |
7.0 |
0.8 |
1.0 |
|
IV |
24617.8 |
7129.8 |
-3.4 |
4.8 |
2.2 |
|
2011* |
106019.4 |
30705.4 |
5.9 |
5.9 |
6.0 |
|
I |
23234.2 |
6729.1 |
-6.9 |
5.9 |
1.6 |
|
II |
27024.4 |
7826.8 |
10.5 |
6.5 |
1.5 |
|
III |
28189.2 |
8164.2 |
7.2 |
6.7 |
1.2 |
|
IV |
27571.6 |
7985.3 |
-5.5 |
4.4 |
0.8 |
|
2012 |
|
|
|
|
|
|
I* |
25298.6 |
7327.0 |
-7.2 |
3.9 |
0.3 |
|
II♦ |
28052.8 |
8124.7 |
8.5 |
2.1 |
0.4 |
◘ Non-final data * Provisional data ♦ First estimate
The chain linking method has been used for the estimation of actual GDP changes as it allows eliminating the price influence.


 «The Baltic Course» Is Sold and Stays in Business!
