
Analytics, Inflation, Lithuania, Markets and Companies
International Internet Magazine. Baltic States news & analytics
Tuesday, 09.06.2026, 09:07
Annual inflation in Lithuania stood at 2.5% in May
 Print version
The overall change in consumer prices was mainly influenced by an increase in prices for clothing and footwear, alcoholic beverages and tobacco products, housing, water, electricity, gas and other fuels groups of goods and services, as well as by a decrease in prices for food products and non-alcoholic beverages. More detailed information is provided in Table 2.
Over the said period, prices for
consumer goods remained almost unchanged, prices for services increased by 0.4%.
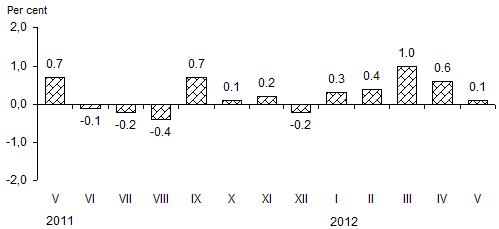 |
| Fig. 1. Monthly changes in prices for consumer goods and services, compared to the previous month |
In May, against April, due to new spring and summer collections, prices for footwear grew by 2.7%, clothing – 0.5%. Prices for other articles of clothing and clothing accessories and for cleaning, repair and hire of clothing increased by 0.6% each.
Over the said period, the highest increase in prices for housing, water, electricity, gas and other fuels groups of goods and services was observed in prices for liquefied gas – by 2.8%, actual rentals for housing – 2.3%, heat energy – 1.3%; prices for solid fuels dropped by 3.1%.
As for alcoholic beverages and tobacco products, the highest increase was observed in prices for spirits – by 0.9%, cigarettes – 0.7%.
As for food products and non-alcoholic beverages, over the month, the most noticeable decrease was observed in prices for eggs – by 14.2%, fruit vegetables (cucumbers, tomatoes, bell peppers) – 9%, salad vegetables and parsley – 8.3%, potatoes – 7.5%, bananas – 6.7%, fresh, chilled or frozen edible offal – 4.1%, while prices for root vegetables (carrots, beetroot) increased by 13%, grain and flour – 2.5%, salted fish – 2.2%.
In May 2012, the annual inflation (May 2012, against May 2011) stood at 2.5%. The annual price change was mostly determined by an increase in prices for housing, water, electricity, gas and other fuels group of goods and services, food products and non-alcoholic beverages, transport goods and services, alcoholic beverages and tobacco products, as well as by a decrease in prices for clothing and footwear.
Over the year, prices for consumer
goods increased by 2.4%, services – 2.8%.
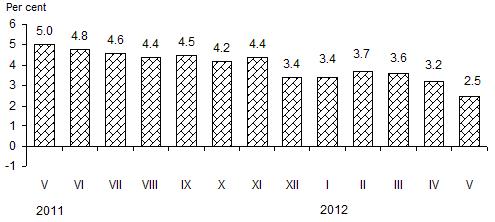 |
| Fig. 2. Annual rates of change in prices for consumer goods and services, compared to the respective month of the previous year |
In May 2012, against May 2011, prices regulated by state and municipal institutions grew by 7.6%, market prices – 1.6%.
In May 2012, average annual inflation stood at 3.9% (in May 2011 – 2.9%).
Table 1. Rates of change in prices for consumer goods and services, May 2012, %
|
COICOP divisions of consumer goods and services |
Relative share (weight) of consumption expenditure in total consumption expenditure |
Growth, drop (-) |
|||
|
May 2012, against |
average annual |
||||
|
April 2012 |
2011 |
May 2011–2012 |
|||
|
December |
May |
||||
|
Total CPI |
100.0 |
0.1 |
2.4 |
2.5 |
3.9 |
|
Food products and non-alcoholic beverages |
26.3 |
-0.5 |
2.8 |
0.9 |
6.0 |
|
Alcoholic beverages and tobacco products |
7.6 |
0.5 |
2.6 |
2.9 |
1.7 |
|
Clothing and footwear |
6.2 |
1.1 |
2.5 |
-1.6 |
-1.0 |
|
Housing, water, electricity, gas and other fuels |
13.9 |
0.4 |
1.5 |
7.4 |
8.9 |
|
Furnishings, household equipment and routine maintenance |
5.8 |
-0.1 |
0.9 |
0.8 |
1.0 |
|
Health care |
6.4 |
0.3 |
1.2 |
2.1 |
1.2 |
|
Transport |
12.8 |
-0.3 |
4.7 |
4.8 |
6.6 |
|
Communications |
3.6 |
0.4 |
0.1 |
-0.9 |
-2.2 |
|
Recreation and culture |
5.9 |
0.5 |
1.6 |
0.7 |
-0.8 |
|
Education |
1.8 |
-0.1 |
1.2 |
1.9 |
1.4 |
|
Hotels, cafes and restaurants |
5.0 |
0.3 |
1.9 |
3.9 |
3.6 |
|
Miscellaneous goods and services |
4.7 |
-0.1 |
3.0 |
3.4 |
1.8 |
Table 2. COICOP classes of consumer goods and services whose rates of change in prices had a decisive influence on the overall price change over the month (May 2012, against April)
Percentage points
|
COICOP classes of consumer goods and services |
Influence |
COICOP classes of consumer goods and services |
Influence |
|
Heat energy |
+0.055 |
Milk and its products, cheese, eggs |
-0.087 |
|
Footwear |
+0.049 |
Vegetables and potatoes |
-0.072 |
|
Tobacco products |
+0.027 |
Fuels and lubricants |
-0.048 |
|
Package holidays |
+0.026 |
Solid fuels |
-0.036 |
|
Pharmaceutical products |
+0.023 |
Fruit and berries |
-0.018 |
|
Clothing |
+0.019 |
Non-durable household goods |
-0.014 |
The change in consumer prices is influenced not only by the size of the price change for a certain product but also by the relative share of expenditure for that product in the total consumption expenditure.
COICOP – Classification of Individual Consumption by Purpose.
Concepts
Inflation – a decrease in the purchasing power of a currency unit, which manifests itself in a long-term increase in the average general price level.
Annual inflation shows relative changes in the average price rate between the current month and the corresponding month of the previous year.
Average annual inflation shows relative changes in the average price rate between the average of the latest twelve months and the average of the corresponding previous twelve months.


 «The Baltic Course» Is Sold and Stays in Business!
