
Analytics, Economics, GDP, Latvia, Markets and Companies, Retail
International Internet Magazine. Baltic States news & analytics
Tuesday, 09.06.2026, 09:07
GDP of Latvia grew by 6.9% in Q1
 Print version
Whereas according to seasonally adjusted data, GDP in the 1st quarter of 2012 has risen by 1.1%, as compared to the 4th quarter of 2011.
|
Year |
Gross Domestic Product (seasonally non-adjusted data) |
Gross Domestic Product per capita* |
|||
|
mln LVL |
at constant prices, as % over corresponding period of previous year |
LVL |
|||
|
at current prices |
at constant prices of 2000 |
at current prices |
at constant prices of 2000 |
||
|
|
|
|
|
|
|
|
2011 |
14 161 |
7 135 |
105.5 |
6 863 |
3 457 |
|
1st quarter |
3 046 |
1 527 |
103.5 |
1 471 |
737 |
|
2nd quarter |
3 505 |
1 760 |
105.6 |
1 698 |
852 |
|
3rd quarter |
3 706 |
1 897 |
106.6 |
1 799 |
920 |
|
4th quarter |
3 903 |
1 951 |
105.7 |
1 897 |
948 |
|
|
|
|
|
|
|
|
2012 |
|
|
|
|
|
|
1st quarter |
3 385 |
1 633 |
106.9 |
1 650 |
796 |
* GDP per capita was re-calculated in compliance with the results of the Population and Housing Census 2011.
Production approach
In comparison with the 1st quarter of 2011, changes in the GDP in the 1st quarter of 2012 were due to the growth in following sectors: trade (share in the GDP structure – 17%) – of 8.1%, manufacturing (15%) – of 16.5%, and transport and storage (14%) – of 4.0%. Construction (4%) witnessed a rise of 28.5%. The collected taxes on products increased by 19.3% (they mainly formed by value added tax, excise and customs duties).
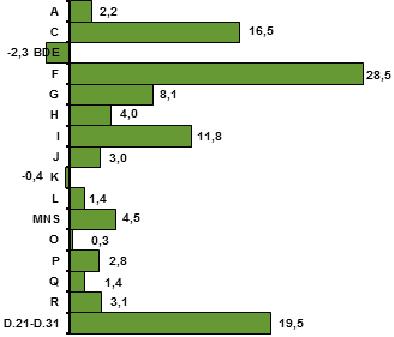 |
| Changes of GDP in the 1st quarter of 2012 by kind of economic activity (NACE Rev. 2, at constant prices, % of the corresponding quarter of the previous year) |
|
A |
agriculture, hunting and forestry; |
|
C |
manufacturing; |
|
BDE |
other manufacturing; |
|
F |
construction; |
|
G |
wholesale, retail trade; repair of motor vehicles, motorcycles, personal, household goods; |
|
H |
transport and storage; |
|
I |
accommodation and food service activities; |
|
J |
information and communication; |
|
K |
financial and insurance activities; |
|
L |
real estate activities; |
|
MNS |
business activities; |
|
O |
public administration and defence; compulsory social security; |
|
P |
education; |
|
Q |
human health and social work activities; |
|
R |
arts, entertainment and recreation; |
|
D.21-D.31 |
product taxes minus subsidies; |
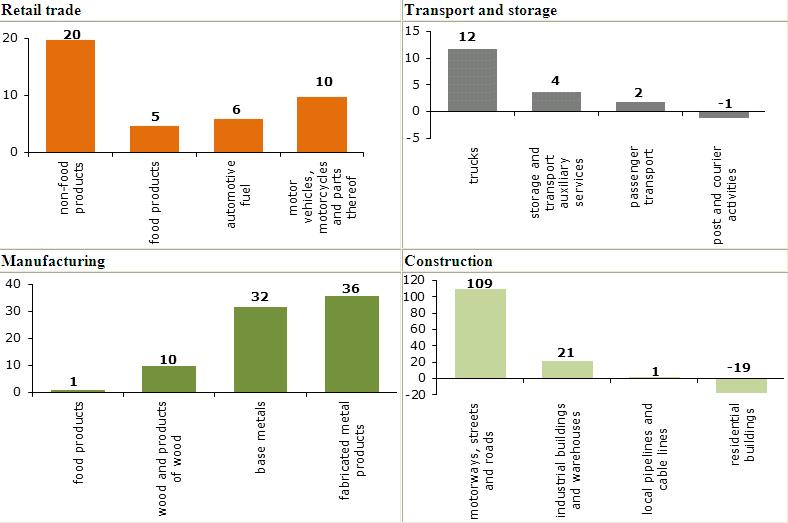 |
| Changes in key industries in the 1st quarter of 2012 (at constant prices, % of the corresponding quarter of the previous year) |
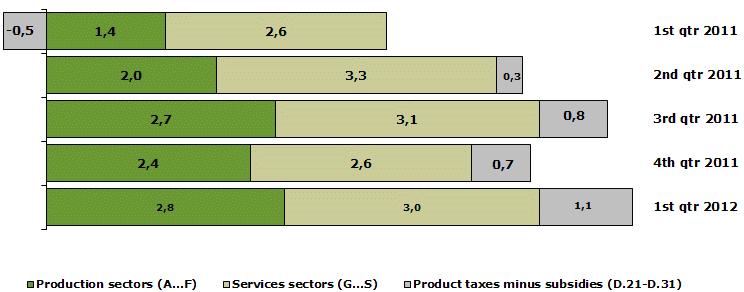 |
| Impact of production approach components on changes of Gross Domestic Product (at constant prices, percentage points) |
Expenditure approach
Compared to the 1st quarter of 2011, private final consumption in the 1st quarter of 2012 (at current prices) grew by 9.6%. Rise was recorded within the main groups of final consumption expenditure: on housing maintenance (29% of total expenditure) – of 6.3%, on food (19%) – of 9%, and on transport (13%) – of 20.3%. Gross capital formation grew by 47.0%, import – by 17.0% and export – by 13.5%. Whereas government final consumption has increased by 5.4%.
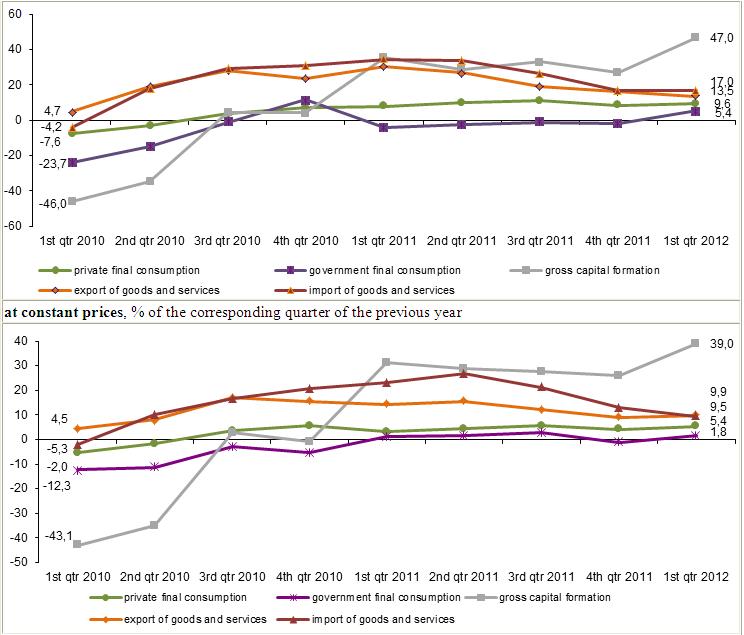 |
| Increase of the Gross Domestic Product by main expenditure component |
Compared to the 1st quarter of 2011, expenditure on private final consumption in the 1st quarter of 2012 (at constant prices) has grown by 5.4%. Expenditure on gross capital formation rose by 39.0%, while government final consumption – by 1.8%. Export of goods (72% of total exports) has increased by 7.9% and the export of services – by 15.4%. However, import of goods (85% of total imports) has risen by 8.8%, but import of services has increased by 13.7%.
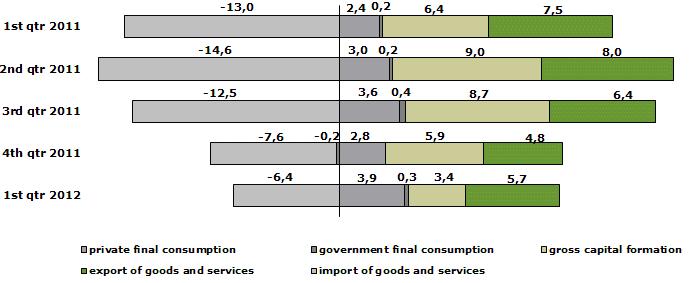 |
| Impact of expenditure approach components on changes of Gross Domestic Product
(at constant prices, percentage points) |
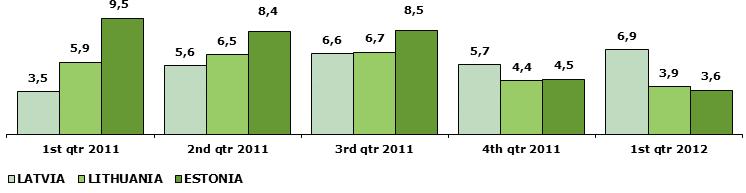 |
| Changes of Gross Domestic Product in the Baltic States (at constant prices, % of the corresponding period of the previous year) |


 «The Baltic Course» Is Sold and Stays in Business!
