
Analytics, Financial Services, Latvia, Markets and Companies, Wages
International Internet Magazine. Baltic States news & analytics
Tuesday, 09.06.2026, 10:04
In 2011 the average monthly gross wages in Latvia grew by 4.4% to LVL 464
 Print version
The average net wages and salaries grew by 4.5% (from LVL 316 to LVL 330). Taking into account the consumer price growth of 4.4%, the real increase of net wages and salaries comprised 0.1%.
In the 4th quarter of 2011 the average monthly gross wages and salaries in the country comprised LVL 475, and, compared to the corresponding period of the year before, the increase constituted 4.5% (from LVL 455 to LVL 475). The growth of the average monthly wages and salaries in the public sector during the year comprised 4.0% (from LVL 487 to LVL 507), of which in general government sector – 3.4% (from LVL 448 to 463), whereas in private sector – 5.4% (from LVL 433 to LVL 457).
If compared to the 3rd quarter of 2011, the average monthly gross wages and salaries in the country in 4th quarter have increased by LVL 8 or 1.8%. In public sector wages and salaries during this period grew by 2.8% (from LVL 493 to LVL 507), whereas in private sector – by 1.1% (from LVL 452 to LVL 457).
Average monthly gross wages and salaries by sector (LVL)
|
|
2010 |
4th qtr 2010
|
2011 |
1st qtr 2011 |
2nd qtr 2011 |
3rd qtr 2011 |
4th qtr 2011 |
Changes, % |
||
|
2011 over 2010
|
4th qtr 2011 over 4th qtr 2010 |
4th qtr 2011 over 3rd qtr 2011 |
||||||||
|
Total |
445 |
455 |
464 |
450 |
463* |
467 |
475 |
4.4 |
4.5 |
1.8 |
|
Private sector |
427 |
433 |
447 |
435 |
443 |
452 |
457 |
4.6 |
5.4 |
1.1 |
|
Public sector |
470 |
487 |
493 |
474 |
497 |
493 |
507 |
4.7 |
4.0 |
2.8 |
|
of which: |
|
|
|
|
|
|
|
|
|
|
|
General government sector |
433 |
448 |
454 |
441 |
458 |
454 |
463 |
4.9 |
3.4 |
2.0 |
In comparison with 2010, a rise of wages and salaries in 2011 was recorded in all economic activities. The most rapid growth in the average monthly gross wages and salaries was observed in other service activities – of 8.8% (this section includes activities of hairdressing and other beauty treatment; activities of public and other organisations; physical well-being activities; repair of computers and personal and household goods; washing and dry-cleaning; funeral and related activities), in real estate activities – of 8.5%, in agriculture, forestry and fishing – of 8.2%, in public administration – of 6.8%, in water supply, sewerage, waste management, and remediation sector – of 6.3% and in trade – of 6.1%.
Monthly gross wages and salaries in manufacturing grew by 5.0%, whereas in construction – by 4.7%.
The lowest growth was recorded in transport and storage sector (of 1.0%), in professional, scientific and technical service activities (of 1.6%) and in mining and quarrying (of 1.9%).
Average monthly gross wages and salaries by main kind of economic activity (LVL)
|
|
2010 |
4th qtr 2010 |
2011 |
1st qtr 2011* |
2nd qtr 2011* |
3rd qtr 2011* |
4th qtr 2011 |
Changes, % |
||
|
2011 over 2010
|
4th qtr 2011 over 4th qtr 2010 |
4th qtr 2011 over 3rd qtr 2011 |
||||||||
|
Total |
445 |
455 |
464 |
450 |
463 |
467 |
475 |
4.4 |
4.5 |
1.8 |
|
Agriculture, forestry and fishing |
415 |
438 |
449 |
423 |
438 |
462 |
470 |
8.2 |
7.3 |
1.7 |
|
Mining and quarrying |
509 |
522 |
518 |
510 |
523 |
504 |
537 |
1.9 |
2.8 |
6.5 |
|
Manufacturing |
406 |
415 |
426 |
409 |
422 |
432 |
440 |
5.0 |
6.0 |
1.9 |
|
Electricity, gas, steam and air conditioning supply |
647 |
643 |
668 |
622 |
672 |
741 |
642 |
3.2 |
-0.3 |
-13.4 |
|
Water supply; sewerage, waste management, and remediation activities |
453 |
476 |
481 |
456 |
491 |
479 |
498 |
6.3 |
4.7 |
4.1 |
|
Construction |
418 |
422 |
437 |
420 |
428 |
446 |
449 |
4.7 |
6.5 |
0.7 |
|
Wholesale and retail trade, repair of motor vehicles and motorcycles |
368 |
374 |
391 |
379 |
390 |
394 |
401 |
6.1 |
7.1 |
1.7 |
|
Transport and storage |
499 |
504 |
504 |
481 |
509 |
501 |
524 |
1.0 |
4.1 |
4.7 |
|
Accommodation and food service activities |
285 |
287 |
300 |
296 |
299 |
307 |
298 |
5.4 |
4.0 |
-2.8 |
|
Information and communication |
760 |
803 |
779 |
768 |
758 |
787 |
804 |
2.6 |
0.1 |
2.1 |
|
Financial and insurance activities |
929 |
920 |
966 |
953 |
964 |
960 |
989 |
4.0 |
7.6 |
3.1 |
|
Real estate activities |
368 |
372 |
399 |
397 |
397 |
400 |
404 |
8.5 |
8.5 |
1.0 |
|
Professional, scientific and technical activities |
582 |
606 |
591 |
576 |
599 |
593 |
594 |
1.6 |
-2.1 |
0.1 |
|
Administrative and support service activities |
420 |
441 |
429 |
418 |
425 |
432 |
441 |
2.1 |
0.0 |
2.1 |
|
Public administration and defence; compulsory social security |
512 |
522 |
547 |
530 |
539 |
544 |
573 |
6.8 |
9.8 |
5.4 |
|
Education |
391 |
409 |
401 |
394 |
410 |
399 |
400 |
2.5 |
-2.2 |
0.1 |
|
Health and social work |
420 |
437 |
440 |
421 |
447 |
442 |
448 |
4.7 |
2.5 |
1.4 |
|
Arts, entertainment and recreation |
369 |
373 |
388 |
377 |
397 |
386 |
392 |
5.2 |
5.0 |
1.6 |
|
Other service activities |
353 |
356 |
383 |
376 |
372 |
386 |
399 |
8.8 |
12.1 |
3.3 |
In the 4th quarter of 2011, if compared to the corresponding period of 2010, the highest growth in wages and salaries among the Baltic States was recorded in Estonia – 6.3% (from EUR 814 to EUR 865). The increase in Latvia comprised 4.5% (from EUR 647 to EUR 676), whereas in Lithuania – 2.5% (from EUR 614 to EUR 630).
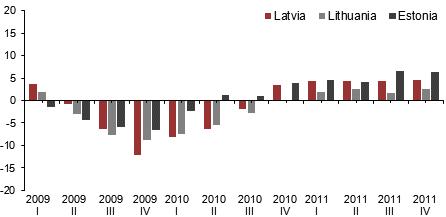 |
| Changes of average monthly gross wages and salaries in the Baltic States over corresponding period of the previous year (per cent) |
More information on wages and salaries in Latvia is available in the CSB data base.
Explanations
Public sector is central and local government institutions and commercial companies, commercial companies with central or local government capital participation 50% and over, as well as foundations, associations and funds, and their commercial companies. The information does not include the data on foundations, associations and funds and their commercial companies.
According to the European System of Accounts (ESA 95) the general government sector includes central and local government institutions, the social security fund, enterprises controlled and financed by the central and local governments.
The changes of average monthly wages and salaries in percent are calculated as not rounded values, i.e., considering the value in santims.
* Data are revised.


 «The Baltic Course» Is Sold and Stays in Business!
