
Analytics, Baltic, Financial Services, Latvia, Markets and Companies, Wages
International Internet Magazine. Baltic States news & analytics
Saturday, 20.04.2024, 07:53
Average gross wages and salaries in Latvia decreased from LVL 461 to 445 or by 3.5% in 2010
 Print version
Compared to the year before, average net wages and salaries in 2010 reduced more rapidly than gross wages and salaries – by 7.5% (from LVL 342 to LVL 316), and it may be explained with the fact that starting from January 1, 2010 population income tax rate grew from 23% to 26%, as well as on July 1, 2009 amount of monthly basic allowance reduced from LVL 90 to LVL 35.
In 4th quarter of 2010 average gross wages and salaries in the country comprised LVL 455, and it is LVL 7 or 1.5% more than in the 3rd quarter.
In public sector during this period wages and salaries grew by 2.5% (from LVL 475 to 487), but in private sector – by 0.7% (from LVL 430 to 433).
Compared to the 4th quarter of 2009, monthly average gross wages and salaries in the country increased by 3.4% (from LVL 440 to LVL 455), in public sector – by 5.1% (from LVL 463 to LVL 487), but in private sector – by 2.1% (from LVL 424 to LVL 433).
Average monthly gross wages and salaries by sectors (LVL)
|
|
2009 |
4th qtr 2009 |
2010 |
1st qtr 2010 |
2nd qtr 2010 |
3rd qtr 2010
|
4th qtr 2010 |
Changes of 2010 as % of 2009
|
Changes of 4th qtr 2010 as % of 4th qtr 2009 |
|
Total |
461 |
440 |
445 |
432* |
444 |
448* |
455 |
-3.5 |
3.4 |
|
Private sector |
433 |
424 |
427 |
421 |
423 |
430 |
433 |
-1.4 |
2.1 |
|
Public sector |
505 |
463 |
470 |
446 |
474 |
475 |
487 |
-6.8 |
5.1 |
|
of which: |
|
|
|
|
|
|
|
|
|
|
General government sector |
472 |
420 |
433 |
410 |
436 |
438 |
448 |
-8.2 |
6.7 |
Compared to 2009 monthly average gross wages and salaries in 2010 witnessed the most significant reduction in education sector – 10.7%, in public administration – 9.0% as well as in construction – 5.3%. Increase during this time period was observed in other service activities, there wages and salaries grew by 6.6%, in agriculture, forestry and fishing growth comprised 5.8%, as well as in electricity, gas, steam and air conditioning supply – 5.5%.
Average monthly gross wages and salaries by main kind of economic activity
|
|
2009 |
2009 4th qtr 2009 |
2010 |
1st qtr 2010*
|
2nd qtr 2010*
|
3rd qtr 2010* |
4th qtr 2010 |
Changes of 2010 as % of 2009
|
Changes of 4th qtr 2010 as % of 4th qtr 2009 |
|
Total |
461 |
440 |
445 |
432 |
444 |
448 |
455 |
-3.5 |
3.4 |
|
Agriculture, forestry and fishing |
392 |
392 |
415 |
392 |
403 |
424 |
438 |
5.8 |
11.7 |
|
Mining and quarrying |
503 |
524 |
509 |
513 |
503 |
500 |
522 |
1.0 |
-0.3 |
|
Manufacturing |
405 |
396 |
406 |
391 |
403 |
412 |
415 |
0.1 |
4.9 |
|
Electricity, gas, steam and air conditioning supply |
614 |
608 |
647 |
575 |
639 |
739 |
643 |
5.5 |
5.9 |
|
Water supply; sewerage, waste management, and remediation activities |
450 |
440 |
453 |
429 |
451 |
454 |
476 |
0.5 |
8.1 |
|
Construction |
441 |
439 |
418 |
426 |
405 |
418 |
422 |
-5.3 |
-3.8 |
|
Wholesale and retail trade, repair of motor vehicles and motorcycles |
384 |
367 |
368 |
364 |
365 |
370 |
374 |
-4.0 |
2.0 |
|
Transport and storage |
498 |
485 |
499 |
484 |
511 |
497 |
504 |
0.2 |
4.0 |
|
Accommodation and food service activities |
284 |
280 |
285 |
275 |
286 |
291 |
287 |
0.1 |
2.2 |
|
Information and communication |
791 |
807 |
760 |
752 |
733 |
752 |
803 |
-4.0 |
-0.5 |
|
Financial and insurance activities |
968 |
932 |
929 |
920 |
949 |
927 |
920 |
-4.1 |
-1.3 |
|
Real estate activities |
374 |
373 |
368 |
363 |
369 |
369 |
372 |
-1.5 |
-0.3 |
|
Professional, scientific and technical activities |
570 |
570 |
582 |
561 |
571 |
586 |
606 |
2.1 |
6.5 |
|
Administrative and support service activities |
418 |
420 |
420 |
405 |
419 |
414 |
441 |
0.5 |
4.9 |
|
Public administration and defence; compulsory social security |
561 |
510 |
512 |
500 |
509 |
516 |
522 |
-9.0 |
1.8 |
|
Education |
439 |
370 |
391 |
362 |
397 |
398 |
409 |
-10.7 |
10.7 |
|
Human health and social work activities |
440 |
410 |
420 |
402 |
421 |
418 |
437 |
-4.6 |
6.4 |
|
Arts, entertainment and recreation |
385 |
371 |
369 |
368 |
369 |
366 |
373 |
-4.5 |
0.0 |
|
Other service activities |
461 |
440 |
353 |
349 |
348 |
358 |
356 |
6.6 |
2.2 |
 |
|
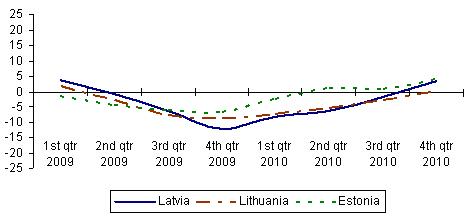
Changes of average gross monthly wages and salaries in Baltic States over the corresponding period of previous year (%) |
In the Baltic States the highest monthly average gross wages and salaries in the 4th quarter of 2010 were recorded in Estonia – EUR 814, in Latvia – EUR 647 and in Lithuania – EUR 614. Compared to the 4th quarter of 2009, average gross wages and salaries have increased in all Baltic States – the most rapid growth was recorded in Estonia and Latvia – 3.9% and 3.4%, respectively, but in Lithuania increase comprised 0.2%.
More information on wages and salaries in Latvia is available in CSB data base.
--------------------------------------------------------------------------------
Explanations
Public sector is central and local government commercial companies, as well as companies with central or local government capital participation 50% and over, foundations, associations and funds, and their commercial companies. Data on foundations, associations and funds and their commercial activities are not included in information.
According to the European System of Accounts (ESA 95) the general government sector includes central and local government budgetary institutions, the social security fund and enterprises controlled and financed by central and local governments.
* Data are revised.


 «The Baltic Course» Is Sold and Stays in Business!
