
Analytics, Industry, Lithuania, Markets and Companies
International Internet Magazine. Baltic States news & analytics
Thursday, 25.04.2024, 19:39
Prices for total industrial production in Lithuania increased by 2.8% in December 2010
 Print version
Prices for products sold on the domestic market over a month grew by 1.2%. The price change was mostly influenced by a 7.1% increase in prices for refined petroleum products, 3.1% – furniture, 2% – chemicals and chemical products, as well as by a 0.4% decrease in prices for electricity, 0.7% – gas, 7.3% – motor vehicles, trailers and semi-trailers.
Prices for food products increased by 0.4%: prices for prepared meals and dishes went up by 6.2%, cocoa, chocolate and sugar confectionary – 4.4%, rusks and biscuits, preserved pastry products – 2.7%, grain mill products – 2%, while prices for processed and preserved fruits and vegetables dropped by 4.7%, condiments and seasonings – 3.9%, poultry – 2.7%. Refined petroleum products excluded, prices for industrial production sold on the domestic market increased by 0.3%.
Prices for exported products in December 2010, compared to November, grew by 4.3%. This was mostly influenced by an 8.2% price increase in prices for refined petroleum products, 5.3% – chemicals and chemical products, 11.3% – crude petroleum, as well as by a 2.8% price drop in prices for metallic products, except machinery and equipment. Refined petroleum products excluded, prices for exported products grew by 1.6%.
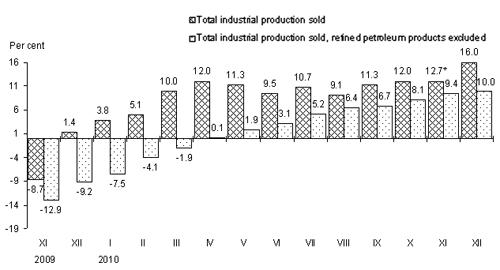
Over a year (December 2010, compared to December 2009) prices for total industrial production sold grew by 16%. This price change was mostly determined by a 33.7% increase in prices for refined petroleum products, 47.8% – chemicals and chemical products, as well as by a 3.1% price drop in prices for repair and installation of machinery and equipment, 1.7% – other non-metallic mineral products, 1.7% – metallic products, except machinery and equipment. Refined petroleum products excluded, prices for industrial production sold increased by 10%.
 |
|
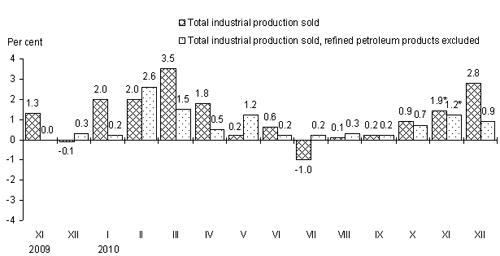
Fig. 1. Changes in prices for industrial production sold over a month, compared to the previous month |
* Revised data.
Prices for products sold on the domestic market over a year increased by 9.7%. The most remarkable impact on changes in prices was made by a 29.7% increase in prices for refined petroleum products, 7.6% – food products, 9.1% – electricity, 18.5% – gas, 17% – steam and hot water, as well as by a 3.5% price drop in prices for metallic products, except machinery and equipment, 4.6% – repair and installation of machinery and equipment.
Prices for exported products over a year grew by 22.5%. This price change was mostly influenced by a 35% increase in prices for refined petroleum products, 60.4% – chemicals and chemical products, 16.4% – food products, as well as by a 14% decrease in prices for beverages, 1.6% – wearing apparel, 2.9% – motor vehicles, trailers and semi-trailers.
 |
|
Fig. 2. Changes in prices for industrial production sold over a year, compared to the corresponding month of the previous year |
* Revised data.
Changes in prices for industrial production sold, December 2010, %
|
Economic activity |
Relative share in industrial production |
Growth, drop (-) | |
|
December 2010, compared to | |||
|
November 2010 |
December 2009 | ||
|
|
|
|
|
|
Total industrial production sold |
100.0 |
2.8 |
16.0 |
|
Mining and quarrying |
1.3 |
4.7 |
14.8 |
|
Manufacturing |
83.2 |
3.4 |
16.6 |
|
Manufacture of refined petroleum products |
25.3 |
8.0 |
33.7 |
|
Electricity, gas, steam and air conditioning supply |
14.2 |
-0.3 |
13.0 |
|
Water supply; sewerage, waste management and remediation activities |
1.3 |
-0.8 |
11.2 |
|
|
|
|
|
|
Total industrial production, refined petroleum products excluded |
74.7 |
0.9 |
10.0 |
|
Manufacturing production, refined petroleum products excluded |
57.9 |
1.1 |
9.2 |
|
|
|
|
|
|
Total industrial production sold on the domestic market |
100.0 |
1.2 |
9.7 |
|
Mining and quarrying |
1.5 |
3.2 |
7.8 |
|
Manufacturing |
69.2 |
1.9 |
8.1 |
|
Manufacture of refined petroleum products |
11.8 |
7.1 |
29.7 |
|
Electricity, gas, steam and air conditioning supply |
28.3 |
-0.3 |
13.0 |
|
Water supply; sewerage, waste management and remediation activities |
1.0 |
-2.8 |
23.0 |
|
|
|
|
|
|
Total industrial production sold on the domestic market, refined petroleum products excluded |
88.2 |
0.3 |
7.0 |
|
Manufacturing production, refined petroleum products excluded |
57.4 |
0.7 |
3.7 |
|
|
|
|
|
|
Total exported industrial production |
100.0 |
4.3 |
22.5 |
|
Mining and quarrying |
1.1 |
6.7 |
24.5 |
|
Manufacturing |
97.3 |
4.4 |
22.7 |
|
Manufacture of refined petroleum products |
39.0 |
8.2 |
35.0 |
|
Electricity, gas, steam and air conditioning supply |
- |
- |
- |
|
Water supply; sewerage, waste management and remediation activities |
1.6 |
0.7 |
4.0 |
|
|
|
|
|
|
Total exported industrial production, refined petroleum products excluded |
61.0 |
1.6 |
14.5 |
|
Manufacturing production, refined petroleum products excluded |
58.3 |
1.5 |
14.6 |
- – the phenomenon (indicator) was not observed in the period in question.


 «The Baltic Course» Is Sold and Stays in Business!
