
Analytics, Industry, Lithuania, Markets and Companies
International Internet Magazine. Baltic States news & analytics
Tuesday, 09.06.2026, 08:29
Prices for Lithuanian industrial production sold grew by 9.1% in August y-o-y
 Print version
This was conditioned by a 0.6% decrease in prices for refined petroleum products, 3.4% – metallic products, except for machinery and equipment, 2.3% – other non-metallic mineral products, as well as by a 0.9% increase in prices for food products, 1.9% – gas, 0.8% – chemicals and chemical products. Refined petroleum products excluded, prices for industrial production sold increased by 0.2%.
Prices for products sold on the domestic market over a month grew by 0.1%. It was mostly influenced by a 1.9% increase in prices for gas, 0.7% – food products, 0.9% – refined petroleum products, 3.1% – chemicals and chemical products, as well as by a 7.4% decrease in prices for metallic products, except for machinery and equipment, 2.8% – other non-metallic mineral products, 2.2% – beverages. As regards the food products, the greatest price increase was observed for grain mill products – 14.7%, prepared feeds for farm animals – 6.2%, while prices for ice-cream dropped by 5.7%, sugar – 2.3%. Refined petroleum products excluded, prices for total industrial production sold on the domestic market dropped by 0.1%.
Prices for exported products in August 2010, compared to July, dropped by 0.1%. This was mostly influenced by a 1% decrease in prices for refined petroleum products, 2.3% – wearing apparel, as well as by a 1.3% increase in prices for food products, 3.4% – motor vehicles, trailers and semi-trailers, 1.4% – rubber and plastic products, 2.1% – metallic products, except for machinery and equipment. Refined petroleum products excluded, prices for exported products grew by 0.6%.
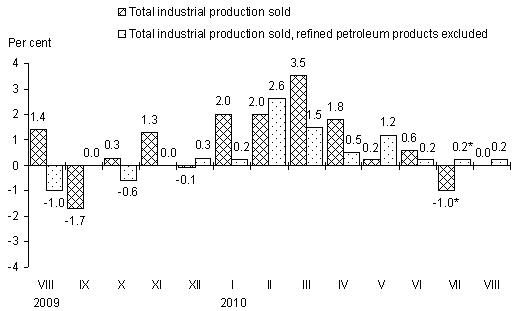 |
| Figure 1. Changes in prices for industrial production sold over a month |
Over a year (August 2010, compared to August 2009) prices for total industrial production sold grew by 9.1%, refined petroleum products excluded – 6.4%. The largest price rise was observed for base metals – 29.6%, chemicals and chemical products – 20.6%, crude oil – 19.2%, refined petroleum products – 17.1%, while tobacco products went down in price by 8.2%, electrical equipment – by 5.3%.
Prices for products sold on the domestic market over a year grew by 6.4%. The largest price rise was observed for crude oil – 24.1%, refined petroleum products – 18.3%, while motor vehicles, trailers and semi-trailers went down in price by 11.2%.
Prices for exported products over a year grew by 11.9%. The largest price rise was observed for base metals and chemicals and chemical products – 40.8% and 24.1% respectively, while prices for beverages and other non-metallic mineral products decreased by 19.2 and 13.5% respectively.
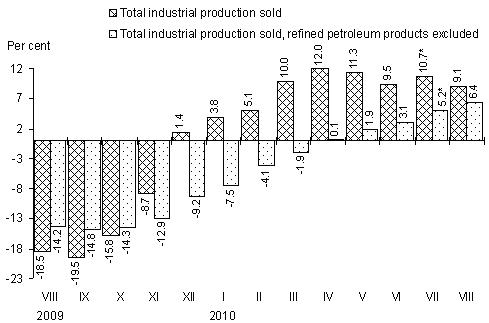 |
| Figure 2. Changes in prices for industrial production sold over a year |
* Revised data.
Changes in prices for industrial production sold, August 2010, %
|
Economic activity |
Relative share in industrial production |
Growth, drop (-) | ||
|
August 2010, compared to | ||||
|
July 2010 |
2009 | |||
|
December |
August | |||
|
Total industrial production |
100.0 |
0.0 |
9.4 |
9.1 |
|
Mining and quarrying |
1.3 |
-0.1 |
6.1 |
6.0 |
|
Manufacturing |
83.2 |
-0.2 |
8.6 |
8.4 |
|
Manufacture of refined petroleum products |
25.3 |
-0.6 |
17.3 |
17.1 |
|
Electricity, gas, steam and air conditioning supply |
14.2 |
0.6 |
14.3 |
13.4 |
|
Water supply; sewerage, waste management and remediation activities |
1.3 |
6.2 |
12.7 |
11.2 |
|
|
|
|
|
|
|
Total industrial production, refined petroleum products excluded |
74.7 |
0.2 |
6.8 |
6.4 |
|
Manufacturing production, refined petroleum products excluded |
57.9 |
-0.1 |
4.8 |
4.6 |
|
|
|
|
|
|
|
Total industrial production sold on the domestic market |
100.0 |
0.1 |
7.0 |
6.4 |
|
Mining and quarrying |
1.5 |
0.6 |
2.8 |
3.8 |
|
Manufacturing |
69.2 |
-0.2 |
3.9 |
3.4 |
|
Manufacture of refined petroleum products |
11.8 |
0.9 |
16.0 |
18.3 |
|
Electricity, gas, steam and air conditioning supply |
28.3 |
0.6 |
14.3 |
13.4 |
|
Water supply; sewerage, waste management and remediation activities |
1.0 |
2.2 |
28.2 |
22.9 |
|
|
|
|
|
|
|
Total industrial production sold on the domestic market, refined petroleum products excluded |
88.2 |
-0.1 |
5.9 |
4.9 |
|
Manufacturing production, refined petroleum products excluded |
57.4 |
-0.5 |
1.4 |
0.4 |
|
|
|
|
|
|
|
Total exported industrial production |
100.0 |
-0.1 |
11.8 |
11.9 |
|
Mining and quarrying |
1.1 |
-1.0 |
10.8 |
8.8 |
|
Manufacturing |
97.3 |
-0.2 |
12.0 |
12.1 |
|
Manufacture of refined petroleum products |
39.0 |
-1.0 |
17.7 |
16.8 |
|
Electricity, gas, steam and air conditioning supply |
- |
- |
- |
- |
|
Water supply; sewerage, waste management and remediation activities |
1.6 |
9.5 |
3.2 |
4.2 |
|
|
|
|
|
|
|
Total exported industrial production, refined petroleum products excluded |
61.0 |
0.6 |
8.1 |
8.7 |
|
Manufacturing production, refined petroleum products excluded |
58.3 |
0.4 |
8.2 |
8.8 |
- – The phenomenon (indicator) was not observed in the period in question.


 «The Baltic Course» Is Sold and Stays in Business!
