
Analytics, Construction, Lithuania, Real Estate
International Internet Magazine. Baltic States news & analytics
Tuesday, 09.06.2026, 13:19
Construction input prices in Lithuania grew by 0.9% in July
 Print version
 |
|
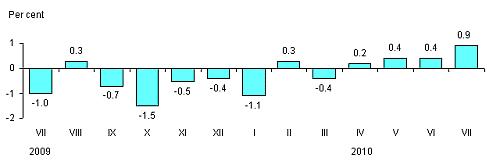
Fig. 1. Monthly changes in construction input prices, compared to the previous month |
In July 2010, compared to June, the overall change in construction input prices was mostly influenced by a 2.9% increase in wages and salaries and overheads. Hourly labour costs of the operation of construction machines and mechanisms grew by 0.1%. Prices for building materials and products in July remained almost unchanged.
The change in prices for building materials and products was mostly influenced by a 0.7% increase in prices for articles of wood, 0.6% – metallic articles, 0.5% – insulation materials, as well as by a 1.7% decrease in prices for finishing materials, 0.5% – pipes, 0.2% – various kinds of concrete and mortar.
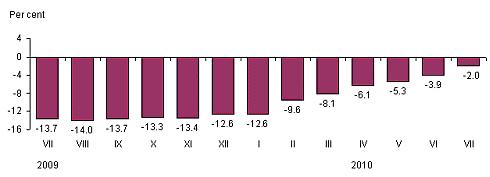
Over the year (July 2010, compared to July 2009), construction input prices dropped by 2%. The annual price drop was conditioned by a decrease (by 3.4%), over twelve months, in prices for building materials and products and an increase (by 1%) in wages and salaries and overheads.
 |
|
Fig. 2. Annual changes in construction input prices, compared to the same month of the previous year |
Table 1. Changes in construction input prices by type of structure, July 2010, %
|
|
Relative share in the total value of new construction |
Growth, drop (-) | ||
|
July 2010, compared to | ||||
|
June 2010 |
2009 | |||
|
December |
July | |||
|
All structures |
100.0 |
0.9 |
0.8 |
-2.0 |
|
Residential buildings |
25.7 |
1.4 |
1.8 |
-1.4 |
|
Non-residential buildings |
44.6 |
0.7 |
0.8 |
-2.4 |
|
Administrative |
10.3 |
0.9 |
2.0 |
-1.2 |
|
Industrial |
16.8 |
0.4 |
-1.2 |
-4.3 |
|
Trade |
17.5 |
0.9 |
2.2 |
-1.3 |
|
Civil engineering units |
29.7 |
0.8 |
0.0 |
-1.9 |
|
In addition, renovation |
x |
1.2 |
2.0 |
-1.0 |
X – the indicator is not calculated in such expression.
Table 2. Changes in prices for the main components of construction input, July 2010, %
|
|
Relative share in the total value of new construction |
Growth, drop (-) | ||
|
July 2010, compared to | ||||
|
June 2010 |
2009 | |||
|
December |
July | |||
|
Total construction costs |
100.0 |
0.9 |
0.8 |
-2.0 |
|
Materials and products |
60.0 |
0.0 |
-0.8 |
-3.4 |
|
Operation of machines and mechanisms |
6.8 |
0.1 |
-1.8 |
-3.0 |
|
Wages and salaries and overheads |
33.2 |
2.9 |
4.8 |
1.0 |


 «The Baltic Course» Is Sold and Stays in Business!
