
Analytics, Latvia, Markets and Companies, Retail
International Internet Magazine. Baltic States news & analytics
Tuesday, 09.06.2026, 13:19
Retail trade turnover in Latvia reduced by 0.5% in July
 Print version
Indices of retail trade turnover (as per cent over average monthly turnover of 2005 at constant prices)
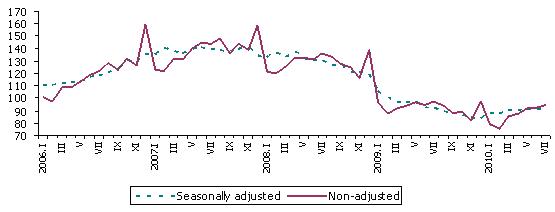
Compared to July 2009 total retail trade turnover in July of this year has decreased by 2%, according to working (trade) day adjusted data, calculating at constant prices. Most notable decrease was recorded in non-food product group – by 2.2%. Retail trade of food products reduced only by 1.8 %.
 |
|
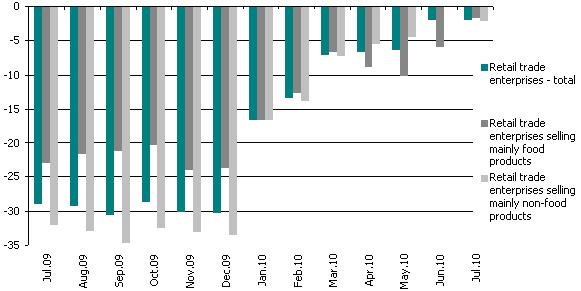
Changes of turnover in retail trade enterprises (as % of corresponding month of previous year, at constant prices, working day adjusted) |
Turnover indices of retail trade enterprises by main kind of economic activity (at constant prices)
|
|
I-VII 2010 as % over I-VII 2009 |
VII 2010 as % over | |
|
VI 2010 |
VII 2009 | ||
|
Total |
92.3 |
99.5 |
98.0 |
|
Total, excluding retail trade of automotive fuel |
92.8 |
100.2 |
100.7 |
|
retail trade with food products, total |
91.0 |
102.1 |
98.2 |
|
retail trade with non-food products, total |
93.0 |
98.2 |
97.8 |
|
retail trade with non-food products, excluding fuel |
94.2 |
98.9 |
102.7 |
|
retail trade in non-specialised stores selling mainly non-food |
98.3 |
101.3 |
108.8 |
|
retail trade in pharmaceutical and medical goods |
95.9 |
103.8 |
105.4 |
|
retail trade in textiles, clothing, footwear and leather ware |
92.5 |
98.6 |
102.7 |
|
retail sale of hardware, paints and glass |
85.5 |
100.4 |
97.2 |
|
retail sale of furniture, lighting equipment and other household articles in specialised stores |
101.9 |
102.3 |
113.7 |
More information on seasonally adjusted data, working day adjusted data and non-adjusted data on retail trade turnover indices is available in the data base of the CSB.


 «The Baltic Course» Is Sold and Stays in Business!
