
Analytics, Economics, GDP, Lithuania
International Internet Magazine. Baltic States news & analytics
Tuesday, 09.06.2026, 08:29
GDP of Lithuania increased by 1.1% in Q2
 Print version
In II quarter 2010 positive changes in the value added created by industrial and services enterprises compensated for the decrease in the added value in the construction sector. The increase in the value added generated by transport, industrial and wholesale enterprises determined positive changes in GDP.
In I quarter 2010, GDP amounted to LTL 44814.3 million, i.e. by 0.9% less than in I quarter 2009 (the changes have been estimated using a chain-linked volume of added value).
 |
|
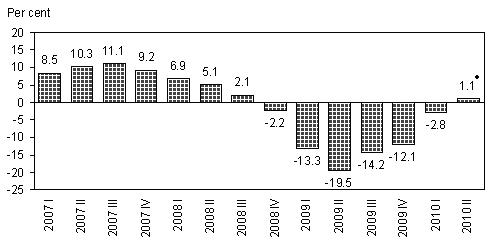
Fig. 1. Changes in gross domestic product, as compared to the corresponding period of the previous year |
♦ Changes in gross domestic product, first estimate.
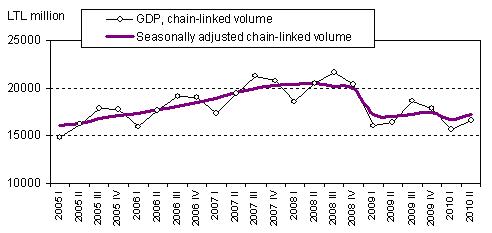 |
| Fig. 2. Changes in gross domestic product |
In II quarter 2010, GDP per capita amounted to LTL 7310.3 at current prices, i.e. by 1.6% more than in the same quarter in 2009 (price change adjusted).
In II quarter 2010, compared to II quarter 2009, seasonally and working day adjusted GDP increased by 1.1%, as compared to I quarter – by 2.9% (see Fig. 2).
REVISED I QUARTER 2010 GROSS DOMESTIC PRODUCT
Statistics Lithuania, based on more detailed quarterly data and having estimated the added value under a more detailed list of economic activities, has revised the second GDP estimate for I quarter 2010. According to the revised data, in I quarter, GDP amounted to LTL 20527.8 million at current prices and, against I quarter 2009, decreased by 2.8% (the previously announced second GDP estimate amounted to LTL 20863.1 million and also dropped by 2.8%).
The revised data are announced in the pre-defined tables and in the Database of Indicators on the website of Statistics Lithuania.
Gross domestic product estimates
|
|
At current prices |
Chain-linked volume, 2000 – 100 |
Changes in seasonally and working day adjusted data,% | ||||
|
LTL million |
EUR million |
LTL million |
Changes,% | ||||
|
As compared to the previous quarter |
As compared to the corresponding quarter of the previous year |
As compared to the previous quarter |
As compared to the corresponding quarter of the previous year | ||||
|
2008 |
111189.8 |
32202.8 |
81020.1 |
2.8 |
2.8 |
2.8 |
2.8 |
|
I |
24636.2 |
7135.1 |
18522.5 |
-11.0 |
6.9 |
0.2 |
7.3 |
|
II |
28697.8 |
8311.5 |
20438.1 |
10.3 |
5.1 |
0.5 |
4.6 |
|
III |
29478.5 |
8537.6 |
21697.8 |
6.2 |
2.1 |
-1.2 |
1.2 |
|
IV |
28377.4 |
8218.7 |
20361.7 |
-6.2 |
-2.2 |
-1.2 |
-1.7 |
|
2009◘ |
92016.1 |
26649.7 |
69042.6 |
-14.8 |
-14.8 |
-14.8 |
-14.8 |
|
I |
20882.1 |
6047.9 |
16066.5 |
-21.1 |
-13.3 |
-13.7 |
-15.3 |
|
II |
23870.5 |
6913.4 |
16461.0 |
2.5 |
-19.5 |
-1.0 |
-16.6 |
|
III |
23799.3 |
6892.7 |
18612.7 |
13.1 |
-14.2 |
1.0 |
-14.7 |
|
IV |
23464.2 |
6795.7 |
17902.3 |
-3.8 |
-12.1 |
1.3 |
-12.5 |
|
2010 |
|
|
|
|
|
|
|
|
I |
20527.8 |
5945.3 |
15609.5 |
-12.8 |
-2.8 |
-4.0 |
-2.7 |
|
II♦ |
24286.4 |
7033.8 |
16634.7 |
6.6 |
1.1 |
2.9 |
1.1 |
◘ Provisional data.
♦ First estimate.


 «The Baltic Course» Is Sold and Stays in Business!
