
Analytics, GDP, Lithuania
International Internet Magazine. Baltic States news & analytics
Tuesday, 09.06.2026, 05:25
GDP per capita in 2008 was growing in all Lithuanian counties
 Print version
Just as in the previous year, in terms of GDP per capita as compared with the national average, Vilnius (154.3%) and Klaipėda (100.1%) counties were in the lead. However, nominal GDP per capita in Vilnius county grew by just 11.5, in Klaipėda county – by 10.7%, i.e. these counties demonstrated the slowest growth in nominal GDP per capita as compared to other counties.
In five counties (those of Alytus, Marijampolė, Panevėžys, Šiauliai and Tauragė), GDP per capita is still below 80% of the national average (in 2007, there were six such counties). In Utena county, the indicator in question in 2008 exceeded the 80% threshold (with 82% of the national average).
In 2008, the gap between Vilnius and other regions did not narrow: GDP per capita in Vilnius county exceeded the indicators of Alytus, Marijampolė, Panevėžys, Šiauliai and Tauragė counties two and more times.
Due to the revision of indicators of national accounts for 1995–1999, Statistics Lithuania has revised data on regional GDP for 1995–1999.
Main indicators by county, 2008
|
|
National |
Counties | |||||||||
|
Alytus |
Kaunas |
Klaipėda |
Marijampolė |
Panevėžys |
Šiauliai |
Tauragė |
Telšiai |
Utena |
Vilnius | ||
|
Gross domestic product, LTL billion* |
111.2 |
3.9 |
21.5 |
12.5 |
3.7 |
6.6 |
8.3 |
1.9 |
4.7 |
4.7 |
43.4 |
|
Structure of gross domestic product,% |
100.0 |
3.5 |
19.3 |
11.3 |
3.3 |
6.0 |
7.4 |
1.7 |
4.2 |
4.2 |
39.0 |
|
Gross domestic product per capita, LTL thous.* |
33.1 |
22.1 |
32.0 |
33.1 |
20.5 |
23.5 |
23.8 |
15.1 |
27.2 |
27.2 |
51.1 |
|
Gross domestic product per capita, against the national average,% |
100.0 |
66.6 |
96.5 |
100.1 |
62.0 |
70.9 |
71.8 |
45.6 |
82.3 |
82.0 |
154.3 |
|
Employed population, |
1521.5 |
75.7 |
303.3 |
168.6 |
77.4 |
125.1 |
158.4 |
44.6 |
69.9 |
75.5 |
422.9 |
|
Population, thous. |
3358.1 |
176.1 |
672.1 |
378.5 |
180.6 |
282.7 |
348.0 |
126.7 |
172.9 |
171.5 |
849.0 |
* Provisional data
** Based on ESA 95
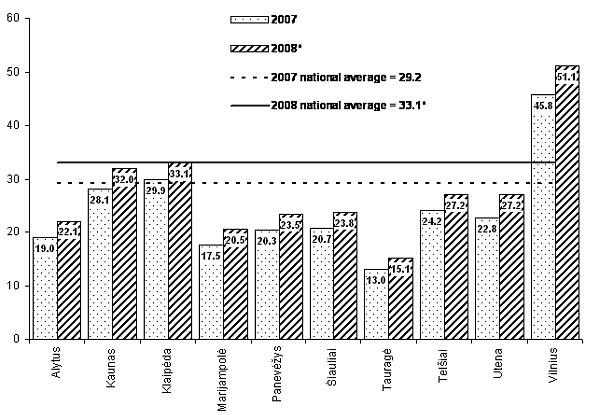 |
| Gross domestic product per capita by county |
* Provisional data.


 «The Baltic Course» Is Sold and Stays in Business!
