
Analytics, Covid-19, Employment, Labour-market, Latvia, Markets and Companies
International Internet Magazine. Baltic States news & analytics
Saturday, 20.04.2024, 11:37
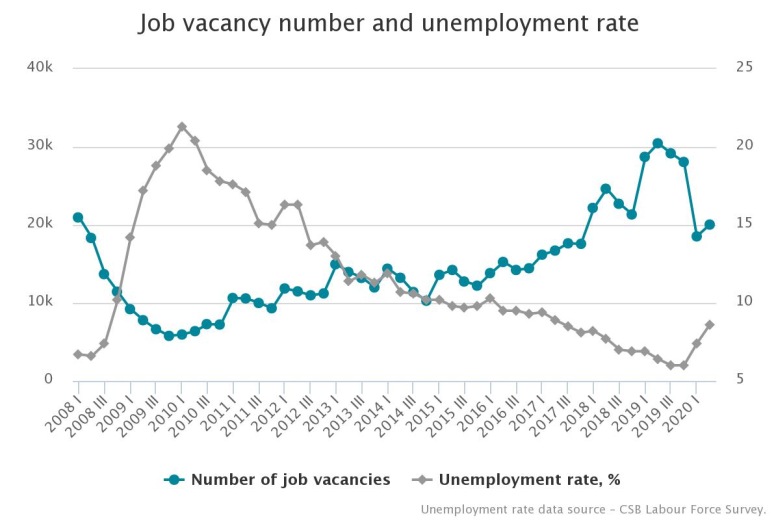
In Q2, number of job vacancies in Latvia dropped by a third
 Print version
Compared to the 1st quarter of 2020, the number of job vacancies rose by 8.2 % or 1.5 thousand. In private sector it increased by 11.8 % or 1.3 thousand, but in public sector – by 3.3 % or 0.3 thousand.
Out of the total number of jobs in Latvia (both occupied and vacant), 2.2 % positions were vacant, of which 2.8 % in public sector and 1.9 % in private sector.
Number of occupied posts reduced by 4.5 %
Compared to the 2nd quarter of 2019, in the 2nd quarter of 2020 number of occupied posts dropped by 41.6 thousand or 4.5 %. In private sector it fell by 35.7 thousand or 5.6 %, but in public sector – by 5.9 thousand or 2.0 %.
Compared to the previous quarter, the number of occupied posts reduced by 19.6 thousand or 2.2 %. In private sector it dropped by 15.0 thousand or 2.4 %, but in public sector – by 4.6 thousand or 1.6 %.
Occupied posts and job vacancies by sector
| At the end of Q2 2019, thousand | At the end of Q2 2020, thousand | Changes, % |
Job vacancies, total | 30.5 | 20.0 | -34.2 |
Private sector | 21.9 | 11.9 | -45.7 |
Public sector | 8.5 | 8.1 | -4.7 |
Occupied posts, total | 924.2 | 882.6 | -4.5 |
Private sector | 634.5 | 598.8 | -5.6 |
Public sector | 289.7 | 283.8 | -2.0 |
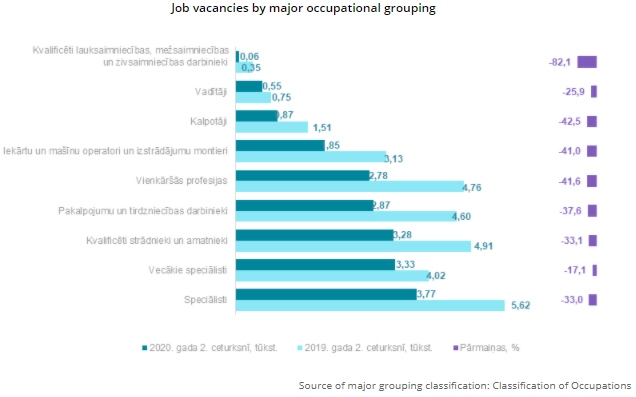
The highest share of job vacancies was recorded among craft and related trades workers (3.5 %), as well as plant and machine operators and assemblers (2.5 %).
In the 2nd quarter of 2020 the most significant drop was observed in demand for all main occupational groupings, but mostly – for craft and related trades workers, elementary occupations, skilled agricultural, forestry and fishery workers, service and sales workers, and professionals.
In the 2nd quarter of 2020, the highest share of job vacancies was recorded in public administration (6.0 %), manufacturing (3.0 %), accommodation and food service activities (2.9 %), mining and quarrying, as well as construction (2.8 %).
Job vacancies and occupied posts by main kind of economic activity
| Q2 2019 | Q2 2020 | ||||
Job vacancies, thousand | Occupied posts, thousand | Job vacancy rate,% | Job vacancies, thousand | Occupied posts, thousand | Job vacancy rate,% | |
Total | 30.5 | 924.2 | 3.2 | 20.0 | 882.6 | 2.2 |
Agriculture, forestry and fishing (A) | 0.8 | 23.2 | 3.3 | 0.3 | 22.7 | 1.3 |
Mining and quarrying (B) | 0.2 | 3.7 | 4.1 | 0.1 | 3.8 | 2.8 |
Manufacturing (C) | 4.6 | 113.5 | 3.9 | 3.3 | 109.2 | 3.0 |
Electricity, gas, steam and air conditioning supply (D) | 0.3 | 11.6 | 2.6 | 0.2 | 11.5 | 1.4 |
Water supply, sewerage, waste management and remediation activities (E) | 0.3 | 8.1 | 3.2 | 0.1 | 7.7 | 1.4 |
Construction (F) | 3.3 | 65.9 | 4.8 | 1.8 | 63.6 | 2.8 |
Wholesale and retail sale; repair of motor vehicles and motorcycles (G) | 5.3 | 147.6 | 3.5 | 1.8 | 139.4 | 1.3 |
Transportation and storage (H) | 2.7 | 77.4 | 3.4 | 1.9 | 70.7 | 2.7 |
Accommodation and food service activities (I) | 1.4 | 38.1 | 3.6 | 0.8 | 27.9 | 2.9 |
Information and communication (J) | 0.8 | 35.0 | 2.2 | 0.7 | 35.6 | 2.0 |
Financial and insurance activities (K) | 0.3 | 17.5 | 1.7 | 0.3 | 16.9 | 1.5 |
Real estate activities (L) | 0.2 | 28.2 | 0.8 | 0.4 | 28.0 | 1.5 |
Professional, scientific and technical activities (M) | 0.8 | 41.2 | 1.8 | 0.2 | 39.3 | 0.6 |
Administrative and support service activities (N) | 1.2 | 41.3 | 2.9 | 0.5 | 38.5 | 1.4 |
Public administration and defence; compulsory social security (O) | 4.1 | 63.9 | 6.1 | 4.0 | 62.6 | 6.0 |
Education (P) | 1.4 | 97.6 | 1.4 | 1.2 | 97.9 | 1.2 |
Human health and social work activities (Q) | 2.2 | 70.2 | 3.0 | 2.0 | 71.6 | 2.7 |
Arts, entertainment and recreation (R) | 0.4 | 25.8 | 1.4 | 0.2 | 23.0 | 1.0 |
Other service activities (S) | 0.2 | 14.4 | 1.7 | 0.0 | 12.7 | 0.3 |
In the 2nd quarter of 2020, the greatest share of job vacancies was observed in Riga region – 2.7 % of all jobs within the region or 13.3 thousand, whereas the lowest – in Zemgale region – 1.1 % or 0.8 thousand.
The highest share of job vacancies in the Baltic countries recorded in Latvia
Among all Baltic countries, in the 2nd quarter of 2020 the highest share of job vacancies (2.2 %) was registered in Latvia. In Lithuania and Estonia this indicator was lower – 1.3 %, but average in the EU – 1.6 %. Over a year the sharpest drop of job vacancies was in Latvia – by 34.2 %, in Estonia – by 27.7 %, but in Lithuania – by 7.4 %.
- 28.01.2022 BONO aims at a billion!
- 25.01.2021 Как банкиры 90-х делили «золотую милю» в Юрмале
- 30.12.2020 Накануне 25-летия Балтийский курс/The Baltic Course уходит с рынка деловых СМИ
- 30.12.2020 On the verge of its 25th anniversary, The Baltic Course leaves business media market
- 30.12.2020 Business Education Plus предлагает анонсы бизнес-обучений в январе-феврале 2021 года
- 30.12.2020 Hotels showing strong interest in providing self-isolation service
- 30.12.2020 EU to buy additional 100 mln doses of coronavirus vaccine
- 30.12.2020 ЕС закупит 100 млн. дополнительных доз вакцины Biontech и Pfizer
- 29.12.2020 В Rietumu и в этот раз создали особые праздничные открытки и календари 2021
- 29.12.2020 Latvia to impose curfew, state of emergency to be extended until February 7


 «The Baltic Course» Is Sold and Stays in Business!
