
Analytics, Baltic Export, Baltic States – CIS, Estonia, EU – Baltic States, Foreign trade
International Internet Magazine. Baltic States news & analytics
Thursday, 25.04.2024, 12:26
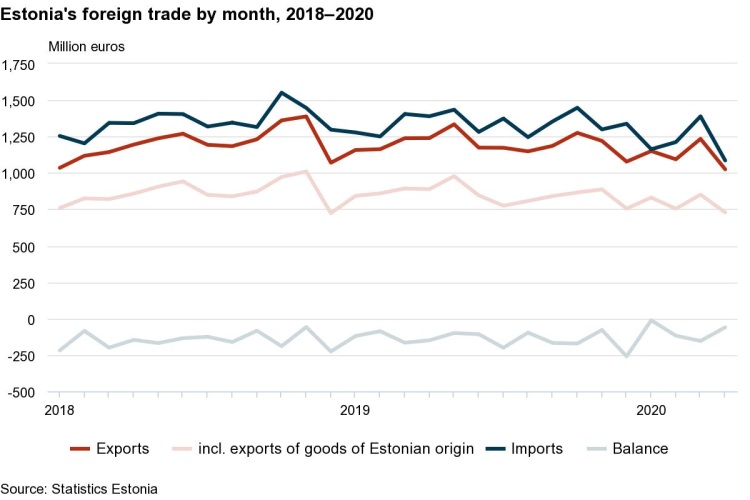
Biggest decrease registered in foreign trade in Estonia in 11 years
 Print version
Estonia’s exports of goods amounted to 1.02 billion euros and imports to
1.09 billion euros at current prices. The trade deficit was 61 million
euros; it decreased by 89 million euros compared to April 2019.
According to Evelin Puura, leading analyst
at Statistics Estonia, the last time trade fell this much was 11 years ago, in
2009. “In April, trade decreased in most commodity sections, but exports and
imports increased for products associated with COVID-19, such as disinfection
products and pharmaceuticals,” explained Puura.
In April, the top
destination country of Estonia’s exports was Finland, followed by Sweden and
Latvia. The biggest decreases occurred in exports to the Netherlands (down by
35 million euros), Russia and Sweden (down by 32 million euros each). Compared
to the previous year, shale oil was exported less to the Netherlands,
mechanical appliances to Russia and electrical equipment to Sweden. Exports
increased the most to Argentina, with more motor fuel dispatched.
The biggest
exports from Estonia were electrical equipment, wood and articles of wood, and
agricultural products and food preparations. The year-on-year decline in
exports came mainly from mineral products (down by 63 million euros), transport
equipment (down by 47 million euros) and electrical equipment (down by 31
million euros). Exports increased the most for raw materials and products of
chemical industry (up by 12 million euros), with highest increases for
disinfection products and nitrogenous fertilisers.
In April, goods of
Estonian origin accounted for 71% of the total exports of goods. Their exports
decreased by 18% and re-exports increased by 16% compared to April 2019. The
biggest decline occurred for shale oil of Estonian origin, as well for
communication equipment and miscellaneous manufactured articles, such as
articles of bedding and similar furnishing.
The main countries
of consignment were Finland, Germany and Lithuania. Imports decreased the most
from Sweden (down by 66 million euros), Germany (down by 42 million euros) and
Russia (down by 35 million euros). From Sweden and Russia, the imports of motor
cars, and from Russia, the imports of fuels decreased the most. Imports of
goods increased the most from Finland (up by 9 million euros), with more motor
fuels imported.
The main
commodities imported to Estonia were raw materials and products of chemical
industry, electrical equipment, agricultural products and food preparations,
and mineral products. The biggest decrease occurred in the imports of transport
equipment (down by 104 million euros), electrical equipment (down by 49 million
euros) and mechanical appliances (down by 47 million euros). Imports grew for
raw materials and products of chemical industry (up by 18 million euros),
mainly driven by pharmaceuticals.
|
Estonia’s foreign trade by month, 2019–2020 |
|||||||||||||||
|
Month |
Exports,
million euros |
Imports,
million euros |
Balance,
million euros |
|
|||||||||||
|
2019 |
2020 |
change, % |
2019 |
2020 |
change, % |
2019 |
2020 |
|
|||||||
|
TOTAL |
4,798 |
4,503 |
-6 |
5,323 |
4,849 |
-9 |
-524 |
-346 |
|
||||||
|
January |
1,158 |
1,150 |
-1 |
1,278 |
1,163 |
-9 |
-120 |
-12 |
|
||||||
|
February |
1,163 |
1,094 |
-6 |
1,251 |
1,212 |
-3 |
-88 |
-118 |
|
||||||
|
March |
1,238 |
1,234 |
0 |
1,405 |
1,389 |
-1 |
-166 |
-155 |
|
||||||
|
April |
1,239 |
1,025 |
-17 |
1,389 |
1,086 |
-22 |
-150 |
-61 |
|
||||||
|
Main foreign trade partners
of Estonia, April 2020 |
|
||||||||||||||
|
Country of destination, group of countries |
Exports,
million euros |
Share, % |
Change on same month of previous year, % |
Country of consignment, group of countries |
Imports,
million euros |
Share, % |
Change on same month of previous year, % |
|
|||||||
|
TOTAL |
1,025 |
100 |
-17 |
TOTAL |
1,086 |
100 |
-22 |
|
|||||||
|
EU-27 |
665 |
65 |
-23 |
EU-27 |
823 |
76 |
-22 |
|
|||||||
|
Euro area 19 |
478 |
47 |
-24 |
Euro area 19 |
631 |
58 |
-18 |
|
|||||||
|
Non-EU and United Kingdom |
360 |
35 |
-4 |
Non-EU and United Kingdom |
263 |
24 |
-21 |
|
|||||||
|
1. Finland |
185 |
18 |
-9 |
1. Finland |
168 |
15 |
6 |
|
|||||||
|
2. Sweden |
97 |
10 |
-25 |
2. Germany |
107 |
10 |
-28 |
|
|||||||
|
3. Latvia |
84 |
8 |
-26 |
3. Lithuania |
104 |
10 |
-24 |
|
|||||||
|
4. Germany |
74 |
7 |
-15 |
4. Latvia |
96 |
9 |
-22 |
|
|||||||
|
5. USA |
73 |
7 |
-1 |
5. Russia |
94 |
9 |
-27 |
|
|||||||
|
6. Lithuania |
51 |
5 |
-26 |
6. Sweden |
79 |
7 |
-46 |
|
|||||||
|
7. Russia |
50 |
5 |
-39 |
7. Poland |
74 |
7 |
-13 |
|
|||||||
|
8. Norway |
38 |
4 |
-5 |
8. Netherlands |
55 |
5 |
-7 |
|
|||||||
|
9. Denmark |
37 |
4 |
-23 |
9. China |
49 |
4 |
14 |
|
|||||||
|
10. Poland |
34 |
3 |
12 |
10. Belgium |
24 |
2 |
-7 |
|
|||||||
|
|||||||||||||||
|
Exports and imports by commodity section, April 2020 |
||||||||
|
Commodity section (chapter)
by Combined
Nomenclature (CN) |
Exports |
Imports |
Balance,
million euros |
|
||||
|
million euros |
share, % |
change on same period of previous year, % |
million euros |
share, % |
change on same period of previous year, % |
|
||
|
TOTAL |
1,025 |
100 |
-17 |
1,086 |
100 |
-22 |
-61 |
|
|
Agricultural products and food preparations
(I–IV) |
99 |
10 |
-6 |
117 |
11 |
-16 |
-18 |
|
|
Mineral
products (V) |
94 |
9 |
-40 |
116 |
11 |
-28 |
-22 |
|
|
Raw materials and products of chemical
industry (VI) |
75 |
7 |
18 |
145 |
13 |
14 |
-70 |
|
|
Articles of plastics and rubber (VII) |
33 |
3 |
-18 |
67 |
6 |
-9 |
-34 |
|
|
Wood and articles of wood (IX) |
121 |
12 |
-9 |
49 |
5 |
0 |
72 |
|
|
Paper and articles thereof (X) |
27 |
3 |
-8 |
20 |
2 |
-19 |
7 |
|
|
Textiles and textile articles (XI) |
26 |
2 |
-24 |
41 |
4 |
-28 |
-14 |
|
|
Base metals and articles of base metal (XV) |
86 |
8 |
-15 |
113 |
10 |
-15 |
-26 |
|
|
Mechanical
appliances (84) |
93 |
9 |
-17 |
105 |
10 |
-31 |
-12 |
|
|
Electrical
equipment (85) |
152 |
15 |
-17 |
124 |
11 |
-28 |
28 |
|
|
Transport
equipment (XVII) |
51 |
5 |
-48 |
65 |
6 |
-62 |
-14 |
|
|
Optical, measuring, precision instruments
(XVIII) |
47 |
5 |
9 |
29 |
3 |
-9 |
18 |
|
|
Miscellaneous
manufactured articles (XX) |
78 |
8 |
-19 |
27 |
2 |
-26 |
51 |
|
|
Other |
43 |
4 |
-1 |
68 |
6 |
5 |
-25 |
|
Statistics Estonia performs the statistical activity “Foreign trade” for
the Ministry of Economic Affairs and Communications with the aim to determine
how exporting and importing enterprises are performing in Estonia.
- 26.08.2021 LLC Dizozols Investments finalizes investment attraction deal with Crowdestor with record-high profits
- 30.12.2020 Hotels showing strong interest in providing self-isolation service
- 30.12.2020 EU to buy additional 100 mln doses of coronavirus vaccine
- 30.12.2020 ЕС закупит 100 млн. дополнительных доз вакцины Biontech и Pfizer
- 29.12.2020 В Латвии вводят комендантский час, ЧС продлена до 7 февраля
- 29.12.2020 Latvia to impose curfew, state of emergency to be extended until February 7
- 29.12.2020 Linde Gas открывает завод в Кедайняйской СЭЗ
- 29.12.2020 Number of new companies registered in Estonia up in 2020
- 29.12.2020 Президент Литвы утвердил бюджет 2021 года
- 29.12.2020 В Риге можно изолироваться в трех гостиницах


 «The Baltic Course» Is Sold and Stays in Business!
