
Analytics, Baltic Export, Baltic States – CIS, Estonia, EU – Baltic States, Foreign trade , Markets and Companies
International Internet Magazine. Baltic States news & analytics
Saturday, 20.04.2024, 13:48
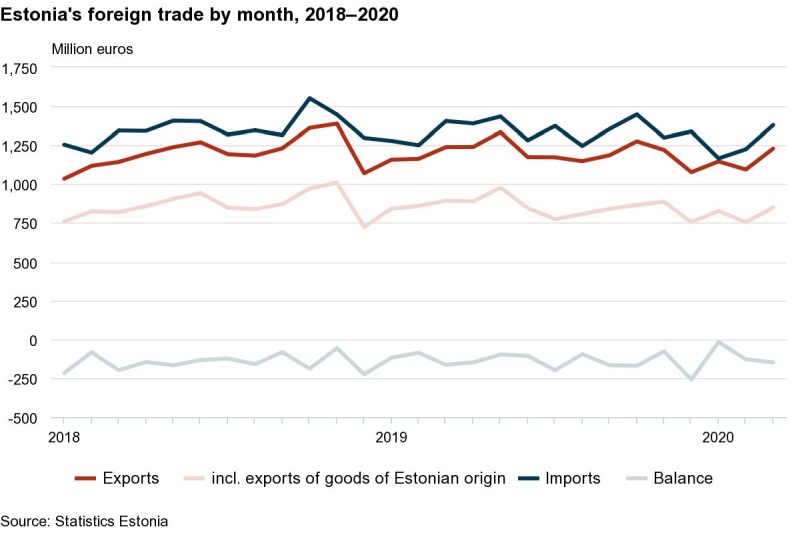
In Q1, exports declined by 3% and imports by 4% in Estonia
 Print version
Estonia’s exports of goods amounted to 1.2 billion euros and imports to 1.4 billion euros at current prices. The trade deficit was 150 million euros; it decreased by 16 million euros compared to March 2019.
According to Evelin Puura, a leading analyst at Statistics Estonia, wood processing equipment and shale oil had a significant impact on the fall in exports in March. “Imports dropped mainly because less electronic integrated circuits and passenger cars were imported,” explained Puura.
The top destination country of Estonia’s exports was Finland, followed by Sweden and Latvia. The biggest decreases occurred in exports to Belgium (down by 21 million euros), France (down by 20 million euros) and Denmark (down by 19 million euros). Compared to the previous year, shale oil was exported less to Belgium and Denmark, and fertilisers were exported less to France. Exports increased the most to Sweden and Finland. More communication equipment was exported to Sweden and more prefabricated wooden buildings were dispatched to Finland.
The biggest exports from Estonia were electrical equipment, mineral products, and wood and articles of wood. The year-on-year decline in exports came mainly from mechanical appliances (down by 21 million euros) and mineral products (down by 16 million euros). Exports increased the most for electrical equipment (up by 21 million euros) and precious metals (up by 19 million euros).
In March, goods of Estonian origin accounted for 69% of the total exports of goods. Their exports decreased by 5% and re-exports increased by 10% compared to March 2019. The biggest decline occurred for aviation spirit and shale oil of Estonian origin as well for machines and mechanical appliances with individual functions and their parts.
The main countries of consignment were Finland, Germany and Lithuania. Imports decreased the most from Sweden (down by 34 million euros), Finland (down by 22 million euros) and Latvia (down by 15 million euros). From Sweden, the imports of electrical and transport equipment decreased the most; from Finland, the imports of mechanical appliances and mineral products; and from Latvia, the imports of mineral products. Imports increased the most from the USA (up by 33 million euros).
The main commodities imported to Estonia were raw materials and products of chemical industry, mineral products, and agricultural products and food preparations. The biggest decrease occurred in the imports of electrical and transport equipment and biggest increase in the imports of raw materials and products of chemical industry and precious metals.
| Month | Exports, million euros | Imports, million euros | Balance, million euros | |||||
|---|---|---|---|---|---|---|---|---|
| 2019 | 2020 | change, % | 2019 | 2020 | change, % | 2019 | 2020 | |
| 1st quarter | 3,559 | 3,469 | -3 | 3,933 | 3,769 | -4 | -374 | -300 |
| January | 1,158 | 1,146 | -1 | 1,278 | 1,166 | -9 | -120 | -19 |
| February | 1,163 | 1,094 | -6 | 1,251 | 1,225 | -2 | -88 | -130 |
| March | 1,238 | 1,229 | -1 | 1,405 | 1,379 | -2 | -166 | -150 |
| Country of destination, group of countries | Exports, million euros | Share, % | Change on same month of previous year, % | Country of consignment, group of countries | Imports, million euros | Share, % | Change on same month of previous year, % |
|---|---|---|---|---|---|---|---|
| TOTAL | 1,229 | 100 | -1 | TOTAL | 1,379 | 100 | -2 |
| EU-27 | 842 | 69 | -1 | EU-27 | 1,040 | 75 | -5 |
| Euro area 19 | 574 | 47 | -6 | Euro area 19 | 773 | 56 | -3 |
| Non-EU and United Kingdom | 386 | 31 | 1 | Non-EU and United Kingdom | 339 | 25 | 9 |
| 1. Finland | 221 | 18 | 14 | 1. Finland | 163 | 12 | -12 |
| 2. Sweden | 160 | 13 | 27 | 2. Germany | 144 | 10 | -4 |
| 3. Latvia | 105 | 9 | -6 | 3. Lithuania | 141 | 10 | 15 |
| 4. USA | 79 | 6 | -6 | 4. Latvia | 122 | 9 | -11 |
| 5. Germany | 75 | 6 | -16 | 5. Russia | 117 | 8 | 2 |
| 6. Lithuania | 68 | 6 | 4 | 6. Sweden | 112 | 8 | -23 |
| 7. Russia | 65 | 5 | -14 | 7. Poland | 96 | 7 | 14 |
| 8. Denmark | 42 | 3 | -31 | 8. Netherlands | 61 | 4 | -2 |
| 9. Norway | 40 | 3 | -21 | 9. USA | 48 | 3 | - |
| 10. Netherlands | 38 | 3 | 52 | 10. China | 40 | 3 | -22 |
| Commodity section (chapter) by Combined Nomenclature (CN) | Exports | Imports | Balance, million euros | ||||
|---|---|---|---|---|---|---|---|
| million euros | share, % | change on same period of previous year, % | million euros | share,% | change on same period of previous year, % | ||
| TOTAL | 1,229 | 100 | -1 | 1,379 | 100 | -2 | -150 |
| Agricultural products and food preparations (I–IV) | 109 | 9 | 13 | 149 | 11 | 9 | -39 |
| Mineral products (V) | 132 | 11 | -11 | 154 | 11 | -5 | -21 |
| Raw materials and products of chemical industry (VI) | 66 | 5 | -1 | 159 | 12 | 20 | -93 |
| Articles of plastics and rubber (VII) | 41 | 3 | 12 | 78 | 6 | 10 | -37 |
| Wood and articles of wood (IX) | 131 | 11 | -5 | 54 | 4 | 14 | 77 |
| Paper and articles thereof (X) | 29 | 2 | 0 | 28 | 2 | 9 | 1 |
| Textiles and textile articles (XI) | 34 | 3 | -9 | 57 | 4 | -8 | -23 |
| Base metals and articles of base metal (XV) | 93 | 8 | -5 | 121 | 9 | -17 | -28 |
| Mechanical appliances (84) | 103 | 8 | -17 | 139 | 10 | -8 | -36 |
| Electrical equipment (85) | 200 | 16 | 11 | 140 | 10 | -21 | 60 |
| Transport equipment (XVII) | 77 | 6 | -7 | 130 | 9 | -20 | -53 |
| Optical, measuring, precision instruments (XVIII) | 43 | 4 | -9 | 32 | 2 | -6 | 11 |
| Miscellaneous manufactured articles (XX) | 111 | 9 | 1 | 37 | 3 | -3 | 74 |
| Other | 59 | 5 | 37 | 103 | 7 | 69 | -44 |
Statistics Estonia performs the statistical activity “Foreign trade” for the Ministry of Economic Affairs and Communications with the aim to determine the economic situation in Estonia.
- 28.01.2022 BONO aims at a billion!
- 26.08.2021 LLC Dizozols Investments finalizes investment attraction deal with Crowdestor with record-high profits
- 30.12.2020 Накануне 25-летия Балтийский курс/The Baltic Course уходит с рынка деловых СМИ
- 30.12.2020 On the verge of its 25th anniversary, The Baltic Course leaves business media market
- 30.12.2020 Hotels showing strong interest in providing self-isolation service
- 30.12.2020 EU to buy additional 100 mln doses of coronavirus vaccine
- 30.12.2020 ЕС закупит 100 млн. дополнительных доз вакцины Biontech и Pfizer
- 29.12.2020 В Латвии вводят комендантский час, ЧС продлена до 7 февраля
- 29.12.2020 Latvia to impose curfew, state of emergency to be extended until February 7
- 29.12.2020 Linde Gas открывает завод в Кедайняйской СЭЗ


 «The Baltic Course» Is Sold and Stays in Business!
