
Analytics, Economics, GDP, Latvia, Statistics
International Internet Magazine. Baltic States news & analytics
Friday, 26.04.2024, 01:50
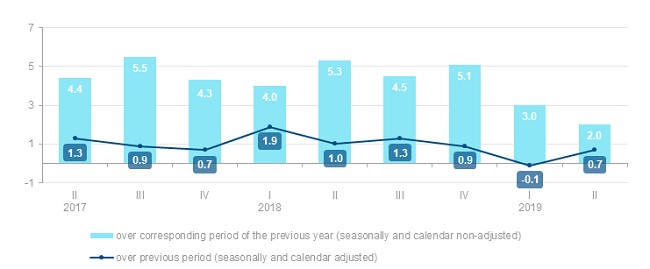
GDP has grown by 2.0% in Q2 in Latvia
 Print version
As
compared to the previous quarter, GDP value (seasonally and calendar adjusted
data) rose by 0.7%.
GDP
value changes at constant prices in the 2nd quarter of 2017 – 2nd quarter
of 2019
(as %)
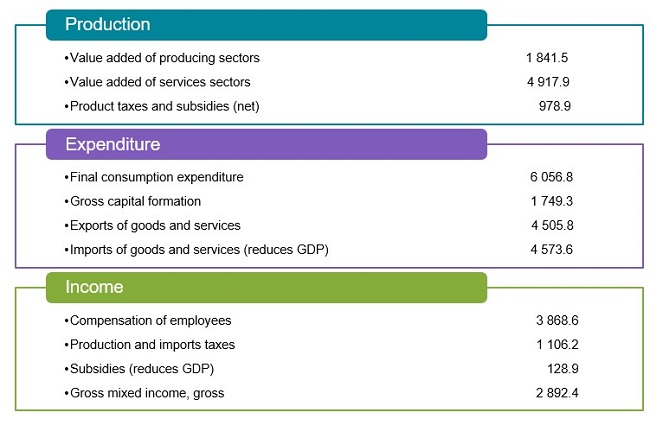
Production
approach
(at constant prices,
seasonally and calendar non-adjusted data)
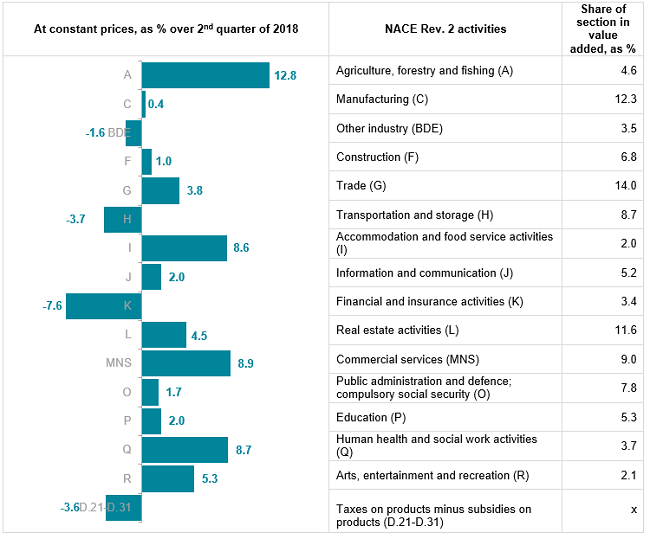
GDP value
changes in the 2nd quarter of 2019 by kind of economic activity
In the 2nd quarter
of 2019, according to the provisional data, there was a significant increase in
agriculture sector – of 24.5%, but in forestry and logging sector – of 5.8%.
The
manufacturing sector grew by 0.4%. Out of the largest manufacturing sectors
output increase was registered only in manufacture of fabricated metal
products, except machinery and equipment – by 11.7%. Rise of 4.1% in printing
sector, of 16.6% – in repair and installation of machinery and equipment, of
25.6% – in manufacture of electrical equipment had positive impact on the
development of the sector. But reduction was observed in manufacture of food
products (of 1.1%), manufacture of wood and of products of wood (of 3.2%) and
manufacture of other non-metallic mineral products (of 7.7%).
Construction
production volume rose by 1.0%. Volume of construction of buildings grew by 4.6%,
volume of civil engineering – reduced by 3.8% (of which, increase of 16.1% was
observed in construction of roads and railways, but fall of 32.4% – in
construction of utility projects). Specialised construction activities are
carried out at the level of the previous year.
Retail
trade increased by 2.5%, of which trade in food products – by 2.7%, but
trade in non-food products (including sale of automotive fuel at gas stations)
– by 2.4%. Wholesale trade, retail trade and repair of motor vehicles and
motorcycles rose by 5.5%, but wholesale – by 4.7%.
In
transport and storage sector decrease of 3.7% was promoted by drop in freight
transport by 4.9%, rise in passenger traffic by 4.3%, fall in warehousing and
support activities for transportation by 7.1% and increase in postal and courier
activities by 19.3%.
Volume of
accommodation and catering services grew by 8.6%, of which accommodation – of
3.5%, but catering – increased by 11.0%.
Information
and communication services grew by 2.0%, including rise of 11.0% in computer
programming and consulting, but telecommunication services and information
services experienced drop, respectively – of 3.3% and 7.0%.
In
financial and insurance activities fall of 7.6% was ensured by decrease of 13.8%
of value added of monetary financial institutions, which was affected by
reduction of profit of financial instruments trading and decrease of commission
income (mainly, in non-resident sector). Insurance, reinsurance and
pension funding sector and other financial activities sectors had positive
impact on the development (rise, respectively, of 15.6% and 12.2%).
Volume of
professional, scientific and technical activities rose by 9.7%, of which
architectural, engineering, technical testing and analysis services – by 10.9%,
activities of head offices; management consultancy activities – by 19.8%, while
drop of 9.2% was observed in scientific and technical activities.
In the 2nd quarter
of 2019 the volume of taxes on products (value added tax, excise and customs
taxes) decreased by 3.2%.
Expenditure
approach
(at constant prices,
seasonally and calendar non-adjusted data)
.
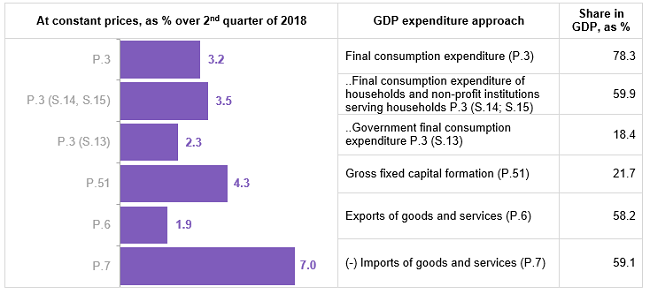
As
household income continued to increase, in the 2nd quarter of
2019 household expenses for final consumption, compared to the corresponding
quarter of the previous year, rose by 3.6%. Household expenditure on food
products rose by 3.1%, on transport (public transport, purchase and
exploitation of transport vehicles) – by 1.2%, expenditure on recreation and
culture – by 4.4%. Household expenditure on dwelling, which is made up by
expenditure on rentals for housing, expenditure on maintenance and repair of
the dwelling, water supply, electricity, gas and other fuels, rose by 3.2%.
These groups of expenditure made up 62% of total household expenditure.
Government final consumption expenditure grew by 2.3%.
Investment
in gross fixed capital rose by 4.3%. Investment in dwellings, other buildings
and structures grew by 1.0%. Investment in machinery and equipment (of which in
transport vehicles) increased by 6.4% and in intellectual property products
(research, computer software, databases, copyrights, etc.) – by 12.9%.
In the 2nd quarter,
exports of goods and services rose by 1.9%, of which exports of goods (69% of
total exports) by 0.6 % and exports of services by 4.9%.
Imports of goods and services grew by 7.0%. Imports of
goods, which comprises 83% of total imports, has risen by 6.9%, but imports of
services – by 7.3%.
Income
approach
(At current prices,
seasonally and calendar non-adjusted data)
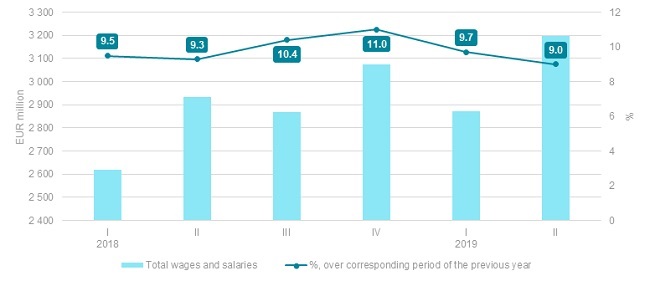
Compared to
the 2nd quarter of 2018, in the 2nd quarter of
2019 compensation of employees at current prices grew by 9.0%, of which total
wages and salaries – by 9.0% and employers' social security contributions – by
9.4%. The sharpest increase in compensation of employees was registered in
construction – by 14.5%, information and communication services – by 12.0%, but
in commercial services sector – by 10.6%.
Total wages and salaries and changes
Gross operating surplus and mixed income increased by 1.4%, whereas the balance of taxes on production and imports and subsidies fell by 0.8%.
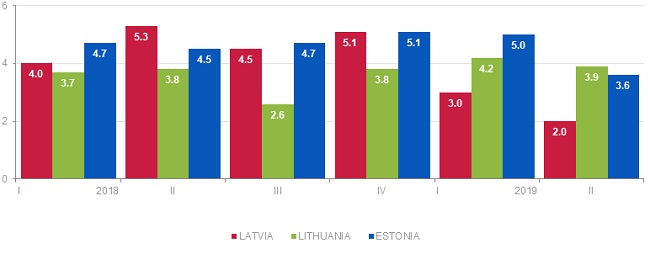
GDP
changes in the Baltic countries
(at constant prices, seasonally
and calendar non-adjusted, as % of the corresponding period of the previous
year)


 «The Baltic Course» Is Sold and Stays in Business!
