
Analytics, Estonia, Foreign trade , Statistics
International Internet Magazine. Baltic States news & analytics
Tuesday, 23.04.2024, 22:31
In February, exports was boosted by the wood sector in Estonia
 Print version
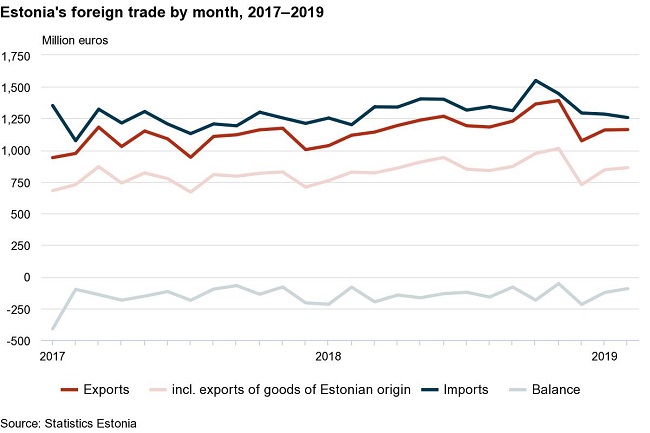
In February, exports (at current prices) from Estonia
amounted to 1.16 bn euros and imports to Estonia to 1.26 bn euros. The
trade deficit was 95 mln euros, which was 12 mln euros more than in the same
period last year.
In February, the top destination countries of Estonia’s
exports were Finland (15% of Estonia’s total exports), Sweden (11%), Latvia and
the USA (both 8%). Electrical equipment and base metals and articles of base
metal were the main commodities exported to Finland; wood and articles of wood
and electrical equipment to Sweden; transport equipment, and agricultural
products and food preparations to Latvia; and electrical equipment, and mineral
products to the USA. The biggest increase occurred in exports to the USA (up by
58 mln euros), the Netherlands and Turkey (both up by 16 mln euros). In exports
to the USA, the biggest increase occurred in data communication equipment, to
the Netherlands in the exports of mineral products and to Turkey in the exports
of wood wheat. The biggest decrease occurred in exports to the United Kingdom
(down by 22 mln euros), where less mineral products were dispatched.
The biggest share in exports of goods was held by electrical
equipment (15% of Estonia’s total exports), followed by mineral products (14%),
and wood and articles of wood (12%). The biggest increase was in the exports of
wood and articles of wood (up by 21 mln euros), miscellaneous manufactured
articles (up by 14 mln euros) and mechanical appliances (up by 11 mln euros).
The biggest decrease occurred in exports of mineral products (down by 23 mln
euros).
The share of goods of Estonian origin in total exports was
74% in February. The exports of goods of Estonian origin grew by 4% and re-exports
by 3% compared to February last year. In the exports of goods of Estonian
origin, the biggest growth was in the exports of wood and articles of wood
(wood pellets, glue-laminated timber, coniferous sawn timber), and
miscellaneous manufactured articles (prefabricated wood buildings, furniture),
whereas the exports of mineral products (shale oil, electricity) decreased.
In February, the main countries of consignment were Finland
(12% of Estonia’s total imports), Germany (11%) and Sweden (10%). Mineral products
and electrical equipment were the main commodities imported from Finland, while
from Germany, transport equipment and mechanical appliances and from Sweden,
electrical and transport equipment were imported the most. Imports increased
the most from Sweden (up by 13 mln euros), boosted by imports of electrical
equipment. Imports decreased the most from Belarus (down by 13 mln euros),
mainly due to the decrease in imports of mineral products by nearly half.
The main commodities imported to Estonia were electrical
equipment (13% of Estonia’s total imports), mineral products (12%), and
transport equipment (11%). The biggest increase was in the imports of raw
materials and products of chemical industry (up by 17mln euros) and the biggest
decrease in the imports of mechanical appliances (down by 12 mln euros).
In February 2019, compared to February 2018, the foreign
trade export volume index increased by 4% and the import volume index decreased
by 1%.
|
Estonia’s foreign trade by month, 2018–2019 |
|||||||||||||||
|
Month |
Exports, million euros |
Imports, million euros |
Balance, million euros |
|
|||||||||||
|
2018 |
2019 |
change, % |
2018 |
2019 |
change, % |
2018 |
2019 |
|
|||||||
|
TOTAL |
2,153 |
2,322 |
8 |
2,454 |
2,542 |
4 |
-301 |
-220 |
|
||||||
|
January |
1,035 |
1,159 |
12 |
1,253 |
1,285 |
2 |
-218 |
-125 |
|
||||||
|
February |
1,118 |
1,162 |
4 |
1,201 |
1,257 |
5 |
-83 |
-95 |
|
||||||
|
Main foreign trade partners of Estonia, February |
|
||||||||||||||
|
Country of destination, group of countries |
Exports, million euros |
Share, % |
Change on same month of previous year, % |
Country of consignment, group of countries |
Imports, million euros |
Share, % |
Change on same month of previous year, % |
|
|||||||
|
TOTAL |
1,162 |
100 |
4 |
TOTAL |
1,257 |
100 |
5 |
|
|||||||
|
EU-28 |
777 |
67 |
1 |
EU-28 |
961 |
76 |
4 |
|
|||||||
|
Euro area 19 |
540 |
46 |
7 |
Euro area 19 |
679 |
54 |
2 |
|
|||||||
|
Non-EU |
386 |
33 |
11 |
Non-EU |
296 |
24 |
9 |
|
|||||||
|
1. Finland |
179 |
15 |
2 |
1. Finland |
152 |
12 |
-3 |
|
|||||||
|
2. Sweden |
126 |
11 |
-3 |
2. Germany |
135 |
11 |
4 |
|
|||||||
|
3. Latvia |
95 |
8 |
1 |
3. Sweden |
123 |
10 |
12 |
|
|||||||
|
4. USA |
94 |
8 |
- |
4. Russia |
114 |
9 |
8 |
|
|||||||
|
5. Germany |
79 |
7 |
-1 |
5. Latvia |
112 |
9 |
2 |
|
|||||||
|
6. Russia |
69 |
6 |
-5 |
6. Lithuania |
103 |
8 |
11 |
|
|||||||
|
7. Lithuania |
60 |
5 |
10 |
7. Poland |
79 |
6 |
6 |
|
|||||||
|
8. Norway |
49 |
4 |
39 |
8. Netherlands |
56 |
4 |
-13 |
|
|||||||
|
9. Netherlands |
47 |
4 |
52 |
9. China |
46 |
4 |
12 |
|
|||||||
|
10. Singapore |
38 |
3 |
36 |
10. Italy |
33 |
3 |
1 |
|
|||||||
|
|||||||||||||||
|
Exports and imports by commodity section, February |
||||||||
|
Commodity section (chapter) by Combined
Nomenclature (CN) |
Exports |
Imports |
Balance, million euros |
|
||||
|
million euros |
share, % |
change compared to same period of previous year, % |
million euros |
share, % |
change compared to same period of previous year, % |
|
||
|
TOTAL |
1,162 |
100 |
4 |
1,257 |
100 |
5 |
-95 |
|
|
Agricultural products and food preparations (I–IV) |
97 |
8 |
8 |
121 |
10 |
6 |
-24 |
|
|
Mineral products (V) |
158 |
14 |
-13 |
153 |
12 |
-4 |
5 |
|
|
Raw materials and products of chemical industry (VI) |
51 |
4 |
-6 |
118 |
9 |
17 |
-67 |
|
|
Articles of plastics and rubber (VII) |
34 |
3 |
-3 |
67 |
5 |
6 |
-33 |
|
|
Wood and articles of wood (IX) |
141 |
12 |
17 |
44 |
3 |
-1 |
97 |
|
|
Paper and articles thereof (X) |
25 |
2 |
-8 |
22 |
2 |
4 |
3 |
|
|
Textiles and textile articles (XI) |
32 |
3 |
4 |
57 |
5 |
10 |
-25 |
|
|
Base metals and articles of base metal (XV) |
94 |
8 |
-1 |
116 |
9 |
6 |
-23 |
|
|
Mechanical appliances (84) |
103 |
9 |
12 |
126 |
10 |
-9 |
-23 |
|
|
Electrical equipment (85) |
175 |
15 |
5 |
166 |
13 |
4 |
10 |
|
|
Transport equipment (XVII) |
72 |
6 |
5 |
134 |
11 |
7 |
-62 |
|
|
Optical, measuring, precision instruments (XVIII) |
36 |
3 |
11 |
29 |
2 |
6 |
7 |
|
|
Miscellaneous manufactured articles (XX) |
102 |
9 |
15 |
33 |
3 |
15 |
68 |
|
|
Other |
43 |
4 |
19 |
71 |
6 |
24 |
-28 |
|


 «The Baltic Course» Is Sold and Stays in Business!
