
Analytics, Latvia, Retail, Statistics
International Internet Magazine. Baltic States news & analytics
Wednesday, 24.04.2024, 08:21
In February, retail trade turnover in Latvia increased by 5.9%
 Print version
Compared to February 2018, turnover growth was recorded in all sectors of retail sale, except retail sale of automotive fuel. Compared to February 2018, the most significant turnover growth was recorded in retail sale in non-specialised stores with non-food products predominating (of 37.2%), retail sale via mail order houses or via Internet (32.6%), as well as retail sale of information and communication equipment (18.1%).
The total retail trade turnover at current prices increased by 7.4% (not taking into account the calendar influence).
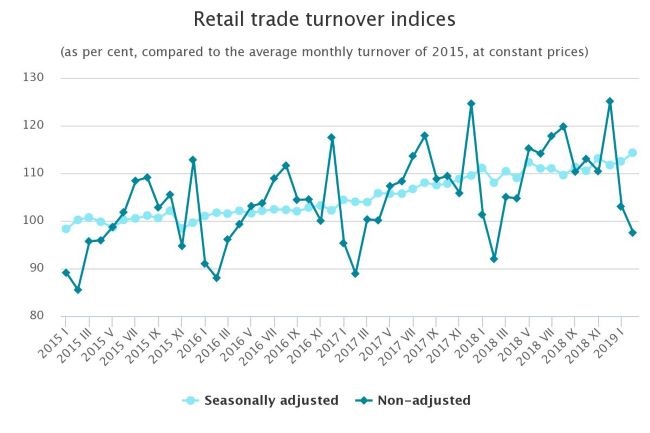
Compared to January, in February 2019 the total turnover of retail trade enterprises grew by 1.6% (according to seasonally adjusted data at constant prices). Turnover of retail trade in food products increased by 2.3%, but turnover of retail trade in non-food products, except for retail sale of automotive fuel, grew by 2.0%. Turnover of retail sale of automotive fuel fell by 0.8%.
Compared to the previous month, the most notable turnover rise was recorded in retail sale via mail order houses or via Internet (of 5.8%) and retail sale of clothing, footwear and leather goods (5.1%). The largest turnover drop, in its turn, was observed in retail sale of pharmaceutical and medical goods (of 3.6%).
Compared to January, in February 2019 the total retail trade turnover of enterprises at current prices (not taking into account seasonality) declined by 5.2%.
Turnover
indices of retail trade enterprises by main kind of economic activity
(at constant prices)
|
|
February 2019
(%), compared to: |
|
|
January 2019 (seasonally
adjusted) |
February 2018
(%), (calendar adjusted) |
|
|
Retail
trade – total |
101.6 |
105.9 |
|
retail
sale of food products, total |
102.3 |
103.4 |
|
retail
sale of non-food products, total |
101.2 |
107.5 |
|
retail
sale in non-specialised stores selling mainly non-food products |
101.9 |
137.2 |
|
retail
sale of information and communication equipment in specialised stores |
98.6 |
118.1 |
|
retail
sale of electrical household appliances in specialised stores |
100.5 |
116.0 |
|
retail
sale of hardware, paints and glass |
103.9 |
113.1 |
|
retail
sale of cultural and recreation goods |
103.5 |
107.8 |
|
retail
sale of pharmaceutical and medical goods |
96.4 |
102.6 |
|
retail
sale of cosmetics and toiletries |
101.6 |
107.1 |
|
retail
sale of clothing, footwear and leather goods |
105.1 |
100.1 |
|
retail
sale in stalls or markets |
103.2 |
110.2 |
|
retail
sale via mail order houses or via Internet |
105.8 |
132.6 |
|
retail
sale of automotive fuel |
99.2 |
98.1 |


 «The Baltic Course» Is Sold and Stays in Business!
