Analytics, Latvia, Statistics, Wages
International Internet Magazine. Baltic States news & analytics
Thursday, 25.04.2024, 01:54
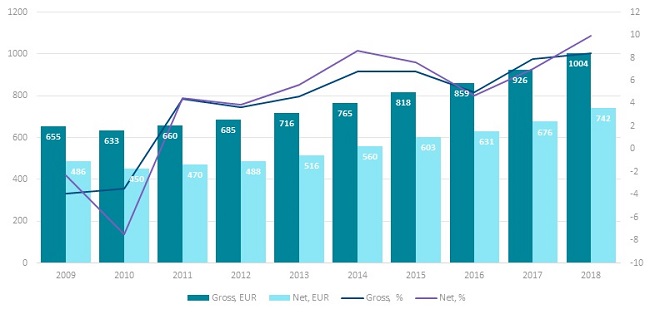
In 2018, average earnings in Latvia constituted EUR 1 004
 Print version
Average earnings after taxes constitute EUR 742
Average net wages and salaries (calculated based on the labour taxes applicable on workplace) comprised EUR 742 or 73.9% of the gross earnings. Over the year, net wages and salaries increased by 9.9%, showing 1.5 percentage points higher rise than that in the wages and salaries before taxes. Considering the consumer price growth of 2.5% in 2018, the real increase of wages and salaries comprised 7.2%.
Median wages and salaries – EUR 774
In 2018, median gross wages and salaries comprised EUR 774, and, compared to 2017 (EUR 707), they went up by 9.5%. In 2018, net median wages (after taxes) amounted to EUR 573 and rose by 11.0% over the year.
Median is calculated based on the information available in statistical surveys and administrative data of the State Revenue Service.
Compared to 2017, in 2018 rise in the minimum wage from EUR 380 to EUR 430 or by 13.2%, introduction of progressive income tax, as well as changes in the size of differentiated untaxable minimum had influence on changes in the average wages and salaries. The mandatory social insurance contributions paid by employees went up by 0.5 percentage points.

Equal rise of earnings in public and private sector
In 2018, the average gross wages and salaries in private sector constituted EUR 991, in public sector EUR 1032, while in general government sector, which includes central and local government institutions, as well as enterprises controlled and financed by the central and local government, it amounted to EUR 985. The increase of earnings in private sector and public sector was similar – of 8.4% and 8.5% annually, respectively, while sharper rise was recorded in general government sector – of 9.0%.
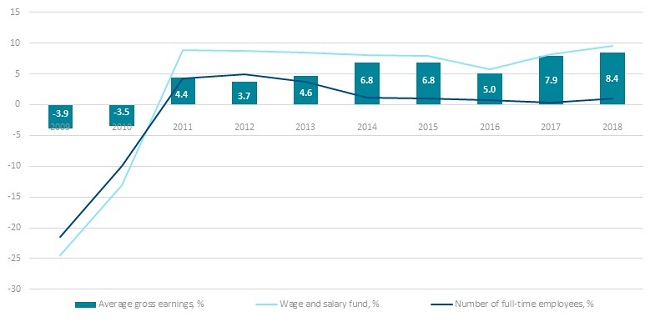
Changes in the average wages and salaries are influenced not only by the rise of employee remuneration, but also by structural changes of the labour market – enterprises that had started and stopped their business during the year, changes in the number of employees and workloads in various economic sectors, as well as state administrative measures in the fight against the shadow economy. The effects caused by the mentioned factors in general may be seen in the changes in the wage and salary fund and number of full-time employees, which are used in the average wage calculations.
In 2018, compared to 2017, gross wage and salary fund increased by 9.5% or EUR 789.7 mln, whereas the number of salaried workers, recalculated into full-time units, grew by 1.0% or 7.8 thousand. It should be noted that during the past five years the average growth rate of the number of full-time employees in the country was very low (within the limits of 0.4–1.0%) and increase in the wage and salary fund was the one having the greatest influence on the changes in the average wages and salaries.

Sharpest rise recorded in human health and social care activities
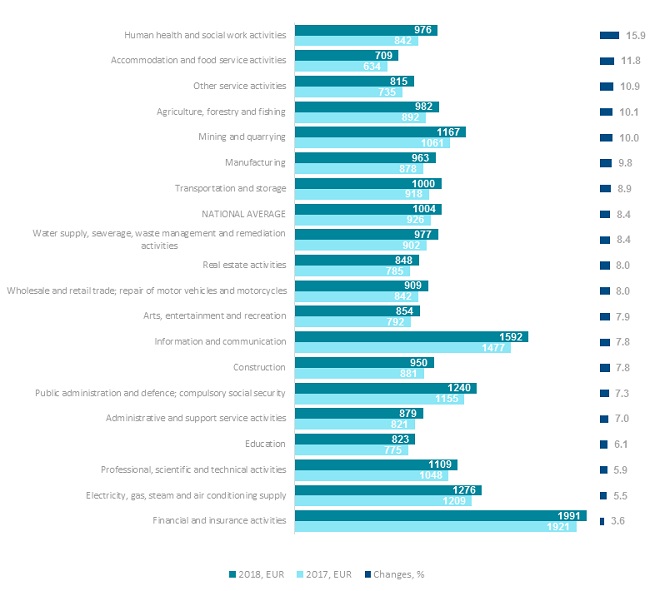
Compared to 2017, the average wages and salaries grew in all economic sectors. The sharpest increase (of 15.9%) was registered in human health and social care activities. Notable rise was recorded also in sectors with comparatively low average earnings: accommodation and food service activities – of 11.8%, and other service activities (that include activities of public and other organisations, repair of computers and personal and household goods, washing and (dry-)cleaning, hairdressing and other beauty treatment, funeral and related activities) – of 10.9%. Over the year, faster growth of the average wages and salaries than the national average was observed also in agriculture, forestry and fishing (rise of 10.1%), mining and quarrying (of 10.0%), manufacturing (9.8%), as well as transportation and storage (8.9%).
In all mentioned economic activities, except for other service activities and transportation and storage, wage and salary fund grew faster than the number of employees. Sharper increase in the average wages and salaries in other service activities and transportation and storage was influenced by the rise in wage and salary fund and decline in the number of full-time employees.
Highest earnings in financial and insurance activities, lowest in accommodation and food service activities
In 2018, just like the year before, the highest wages and salaries for full-time work were registered in financial and insurance activities, information and communication, energy, public administration and defence, mining and quarrying, as well as professional, scientific and technical activities. In other sectors, the average wages and salaries before taxes were below the national average.
The lowest average earnings, in turn, were registered in accommodation and food service activities, other service activities, education, real estate activities, as well as arts, entertainment and recreation.

Lowest earnings still recorded in Latgale
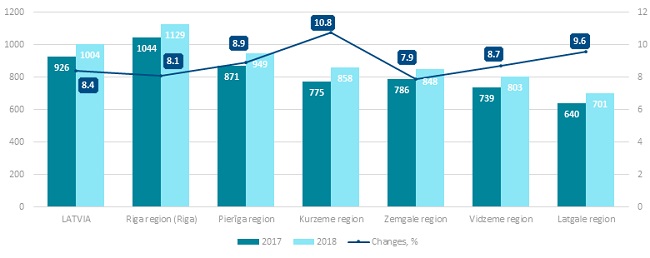
Compared to 2017, in 2018 regional breakdown shows the sharpest rise in the average monthly gross wages and salaries in Kurzeme (of 10.8%), Latgale (9.6%) and Pierīga region (8.9%). The lowest rise was recorded in Zemgale – 7.9%.
The lowest average gross wages and salaries still were observed in Latgale region – EUR 701 for full-time work, followed by Vidzeme with EUR 803, Zemgale with EUR 848, Kurzeme with EUR 858, whereas indicator registered in Pierīga region amounted to EUR 949. In 2018, the average wages and salaries in Riga amounted to EUR 1129, which is a rise of EUR 85 or 8.1%, compared to 2017.

Information on the average wages and salaries is broken down by region based on the address of the office or main activity of an enterprise or institution.
In the 4th quarter, average earnings before taxes amounted to EUR 1042
In the 4th quarter of 2018, the average monthly gross wages and salaries in the country comprised EUR 1042, and over the year they have grown by 8.3%. Compared to other quarters of 2018, in the 4th quarter the share of irregular bonuses and premiums in total earnings was the highest – 7.4% (approximately 5.0% in other quarters).
Compared to the 4th quarter of 2017, in the 4th quarter of 2018 the highest rise in the average wages and salaries was recorded in public sector – of 8.9%, in private sector it constituted 8.1%, and in general government sector 8.9%.
Compared to the 3rd quarter of 2018, gross wages and salaries in the country grew by 3.5%. Sharper increase was observed in public sector – 5.2%, compared to 2.6% in private sector. The average wages and salaries in general government sector went up by 4.7%.
In the 4th quarter, net wages and salaries comprised EUR 768, and, compared to the 4th quarter of 2017, they went up by 9.7%. Compared to the 3rd quarter of 2018, wages and salaries rose by 3.3%.
Average monthly gross wages and salaries in 2018 by sector
(EUR)
Period | Total in the country | Private sector | Public sector | of which |
general government sector | ||||
Q1 | 961 | 958 | 969 | 923 |
Q2 | 1005 | 991 | 1035 | 984 |
Q3 | 1007 | 994 | 1036 | 993 |
Q4 | 1042 | 1020 | 1089 | 1040 |
Year | 1004 | 991 | 1032 | 985 |
*Data on 1st–3rd quarter are revised.
Changes in average monthly gross wages and salaries in 2018 by sector
(as per cent, compared to the corresponding period of 2017)
Period | Total in the country | Private sector | Public sector | of which |
general government sector | ||||
Q1 | 8.7 | 9.0 | 8.1 | 9.0 |
Q2 | 8.4 | 8.5 | 8.4 | 9.2 |
Q3 | 8.1 | 7.9 | 8.5 | 8.9 |
Q4 | 8.3 | 8.1 | 8.9 | 8.9 |
Year | 8.4 | 8.4 | 8.5 | 9.0 |
*Data on 1st–3rd quarter are revised.
Changes in average monthly gross wages and salaries in 2018 by sector
(as per cent, compared to the previous period)
Period | Total in the country | Private sector | Public sector | of which |
general government sector | ||||
Q1 | 0.0 | 1.5 | -3.1 | -3.4 |
Q2 | 4.5 | 3.4 | 6.8 | 6.6 |
Q3 | 0.2 | 0.3 | 0.1 | 0.9 |
Q4 | 3.5 | 2.6 | 5.2 | 4.7 |
Year | 8.4 | 8.4 | 8.5 | 9.0 |
*Data on 1st–3rd quarter are revised.


 «The Baltic Course» Is Sold and Stays in Business!

