
Analytics, Inflation, Lithuania, Statistics
International Internet Magazine. Baltic States news & analytics
Tuesday, 23.04.2024, 11:12
Changes in prices in Lithuania calculated based on the HICP
 Print version
Fig. 1. Average annual inflation calculated based on the HICP
%
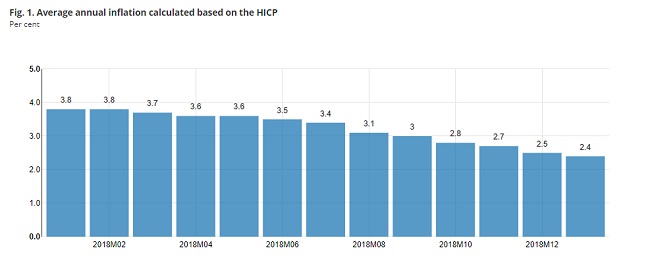
- In
January 2019, annual inflation (January 2019, against January 2018)
calculated based on the HICP stood at 1.6% and was by 0.1
percentage points lower than the CPI-based one.
Fig. 2. Annual inflation calculated based on the HICP
%
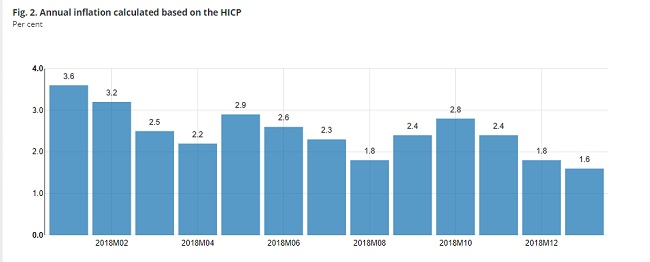
In January 2019, against December 2018, the overall change
in prices for consumer goods and services calculated based on the HICP was
negative and stood at minus 0.1%. The overall change in prices for
consumer goods and services calculated based on the CPI stood at 0.2%.
Table 1. Rates of change in prices for consumer goods and services calculated based on the HICP, January 2019
ECOICOP1 divisions of consumer goods and services | Relative share (weight) in total consumption expenditure, ‰ | Price growth, drop (–), % | ||
January 2019, against | Average annual | |||
December 2018 | January 2018 | |||
Consumption goods and services | 1 000.0 | –0.1 | 1.6 | 2.4 |
Food products and non-alcoholic beverages | 197.9 | 1.0 | –0.1 | 1.2 |
Alcoholic beverages and tobacco products | 73.4 | 0.4 | 3.0 | 3.3 |
Clothing and footwear | 67.9 | –8.0 | –2.2 | –0.1 |
Housing, water, electricity, gas and other fuels | 111.4 | 2.7 | 5.2 | 3.2 |
Furnishings, household equipment and routine maintenance | 72.0 | 0.6 | 1.7 | 0.8 |
Health care | 59.4 | 1.5 | 4.5 | 1.7 |
Transport | 154.7 | –2.2 | 0.0 | 4.4 |
Communications | 28.0 | 0.3 | –1.0 | –1.4 |
Recreation and culture | 84.0 | 0.1 | 1.1 | 2.1 |
Education | 13.3 | –0.2 | 3.0 | 3.1 |
Hotels, cafes and restaurants | 61.9 | 0.3 | 5.6 | 5.3 |
Miscellaneous goods and services | 76.1 | 1.7 | 2.5 | 2.9 |
_________________________________
1 European Classification of Individual Consumption According to Purpose – ECOICOP


 «The Baltic Course» Is Sold and Stays in Business!
