
Analytics, Baltic, EU – Baltic States, Labour-market, Latvia, Statistics
International Internet Magazine. Baltic States news & analytics
Friday, 19.04.2024, 23:56
Latvian unemployment rate constituted 7.0 % in 3Q 2018
 Print version
In the 3rd quarter, in Latvia there were 68.8 thousand unemployed persons aged 15–74 (incl.), which is 15.3 thousand people less than a year ago and 6.6 thousand people less than in the previous quarter.
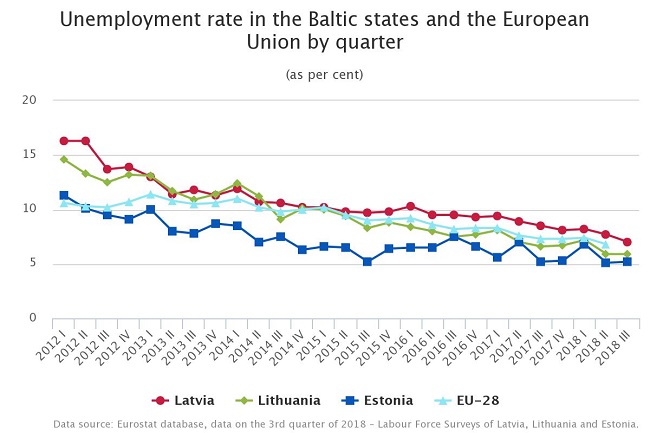
Since the 3rd quarter of 2008, Latvian unemployment rate exceeds the European Union (EU) average (except for the 1st quarter of 2015 when both indicators were equal). In the 2nd quarter of 2018, Latvian unemployment rate (constituting 7.7%) exceeded the EU average (6.8 %) by 0.9 percentage points. In the 3rd quarter of 2018, Latvia still had the highest unemployment rate in the Baltic states – 7.0%, compared to 5.2% in Estonia and 5.9% in Lithuania.
Long-term unemployed persons
Over the year, the share of long-term unemployed persons, i.e., those who have been without work for 12 months or longer, in the total number of unemployed persons grew – from 40.1% in the 3rd quarter of 2017 to 43.1% in the 3rd quarter of 2018 or by 3 percentage points. The number of long-term unemployed persons, in its turn, reduced by 4.2 thousand, constituting 29.4 thousand in the 3rd quarter of 2018.
Youth unemployment
In the 3rd quarter of 2018, youth unemployment rate constituted 11.0%, which is 6.6 percentage points lower than a year ago and 0.2 percentage points lower than in the previous quarter. During the year, the number of young unemployed persons fell by 5.6 thousand.
In the 3rd quarter, young people aged 15–24 accounted for 7.7 thousand or 11.2% of all unemployed persons. Over the year, their share in the total number of unemployed persons fell by 4.6 percentage points, whereas compared to the 2nd quarter, the indicator grew by 1.3 percentage points.
In the 3rd quarter, 40.7% of all young people were active, i.e., employed or actively seeking a job (unemployed), while 59.3% of young people were inactive (mainly studying and not seeking a job).
Inactive population
In the 3rd quarter of 2018, 29.8 % or 420.7 thousand people aged 15–74 (incl.) were inactive. i.e., were neither employed nor actively seeking a job. Compared to the 2nd quarter of 2018, inactive population declined by 7.3 thousand people or 1.7%, whereas over the year it fell by 12.3 thousand people or 2.8%.
In the 3rd quarter, 17.2 thousand people or 4.1 % of the inactive population were discouraged to find a job (compared to 4.5% in the 3rd quarter of 2017 and 2.6% in the 2nd quarter of 2018).
In the 3rd quarter of 2018, Labour Force Survey questions about economic activity were asked to 7.3 thousand people aged 15–74 living in 4.1 thousand households.


 «The Baltic Course» Is Sold and Stays in Business!
