
Analytics, Inflation, Lithuania, Statistics
International Internet Magazine. Baltic States news & analytics
Thursday, 25.04.2024, 17:20
October harmonized average annual inflation stood at 2.8% in Lithuania
 Print version
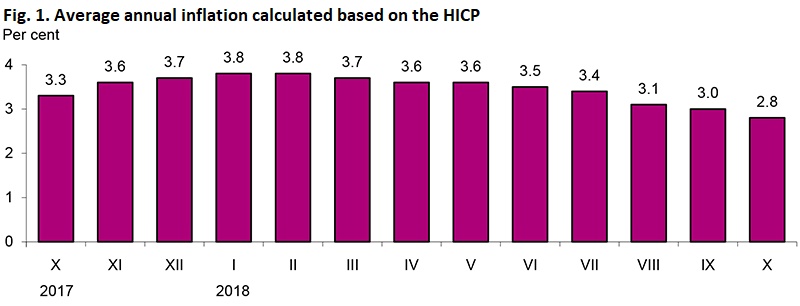
In October 2018, annual inflation (October 2018, against October 2017) calculated
based on the HICP stood at 2.8% and was by 0.1 percentage point lower
than the CPI-based one.
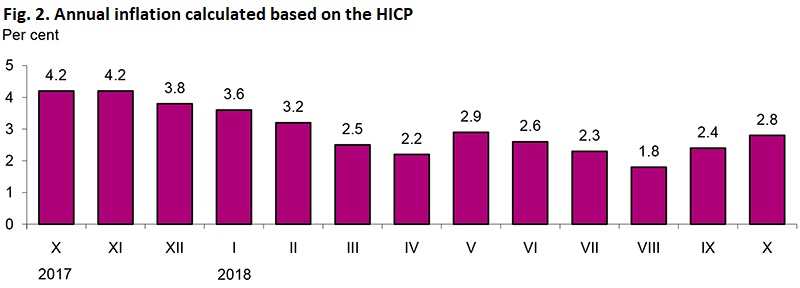
In October 2018, against September, the increase in prices for consumer
goods and services calculated based on the HICP stood at 0.5%. The monthly
increase in prices calculated based on the CPI stood at 0.6%.
Table 1. Rates of change in prices for consumer goods and services
calculated based on the HICP, October 2018
|
ECOICOP1 divisions
of consumer goods and services |
Relative
share (weight) in total consumption expenditure, ‰ |
Price growth, drop (–), % |
||
|
October 2018, against |
Average annual |
|||
|
September 2018 |
October 2017 |
|||
|
Consumption goods and services |
1 000.0 |
0.5 |
2.8 |
2.8 |
|
Food products and non-alcoholic beverages |
203.8 |
–0.3 |
0.5 |
2.2 |
|
Alcoholic beverages and tobacco products |
78.2 |
–0.1 |
3.2 |
5.2 |
|
Clothing and
footwear |
69.0 |
5.2 |
–0.4 |
0.6 |
|
Housing, water, electricity, gas and other fuels |
106.2 |
2.0 |
4.7 |
2.9 |
|
Furnishings, household equipment and routine
maintenance |
71.1 |
1.3 |
1.3 |
0.5 |
|
Health care |
58.1 |
0.3 |
2.2 |
1.3 |
|
Transport |
154.9 |
0.7 |
8.2 |
4.7 |
|
Communications |
28.8 |
–0.3 |
–1.4 |
–0.8 |
|
Recreation and
culture |
84.9 |
–1.2 |
1.3 |
2.5 |
|
Education |
12.9 |
0.3 |
3.6 |
2.9 |
|
Hotels, cafes and
restaurants |
55.0 |
–0.8 |
4.9 |
5.4 |
|
Miscellaneous
goods and services |
77.1 |
0.0 |
2.5 |
3.5 |
_____________________________
1 European Classification of Individual Consumption According
to Purpose (ECOICOP).
Table 2. ECOICOP classes of consumer goods and services whose rates of
change in prices had the biggest impact on the overall price change
|
ECOICOP classes
of consumer goods and services |
Relative
share (weight) in total consumption expenditure, ‰ |
Price growth, drop (–), % |
Impact, percentage points |
|
October 2018, against September |
|||
|
Clothing |
46.5 |
5.4 |
0.238 |
|
Fuels and
lubricants |
65.8 |
2.8 |
0.198 |
|
Heat energy |
28.0 |
5.4 |
0.137 |
|
Footwear |
18.4 |
5.3 |
0.094 |
|
Non-durable
household goods |
14.5 |
5.3 |
0.075 |
|
Products and materials for the maintenance and
repair of the dwelling |
15.3 |
1.6 |
0.024 |
|
Spirits |
18.5 |
–1.1 |
–0.021 |
|
Milk and milk products, cheese, eggs |
39.0 |
–0.6 |
–0.023 |
|
Vegetables |
21.1 |
–2.3 |
–0.052 |
|
Accommodation
services |
13.6 |
–4.3 |
–0.065 |
|
Passenger
transport by air |
10.0 |
–10.8 |
–0.099 |
|
Package holidays |
10.0 |
–10.0 |
–0.114 |
|
October 2018, against October 2017 |
|||
|
Fuels and
lubricants |
65.8 |
16.7 |
1.074 |
|
Solid fuel |
11.8 |
25.8 |
0.302 |
|
Vegetables |
21.1 |
15.0 |
0.251 |
|
Tobacco products |
26.9 |
6.8 |
0.184 |
|
Catering services of restaurants, cafés and the
like |
32.5 |
5.4 |
0.176 |
|
Maintenance and repair of personal transport
equipment |
15.5 |
10.8 |
0.167 |
|
Clothing |
46.5 |
–0.7 |
–0.032 |
|
Equipment for the reception, recording and
reproduction of sound and pictures |
8.5 |
–4.3 |
–0.037 |
|
Cars |
27.6 |
–1.7 |
–0.045 |
|
Coffee, tea and
cocoa |
9.3 |
–4.8 |
–0.046 |
|
Sugar, jam, honey, chocolate and confectionery |
11.6 |
–4.9 |
–0.064 |
|
Fruit |
11.0 |
–9.4 |
–0.107 |
The overall change in consumer prices is influenced not only by the size
of the price change for a certain product but also by the relative share
(weight) of expenditure on that product in the total consumption expenditure.


 «The Baltic Course» Is Sold and Stays in Business!
