
Analytics, Foreign trade , Latvia, Statistics
International Internet Magazine. Baltic States news & analytics
Thursday, 18.04.2024, 17:52
In August, foreign trade turnover in goods was 11.3% larger than last year in Latvia
 Print version
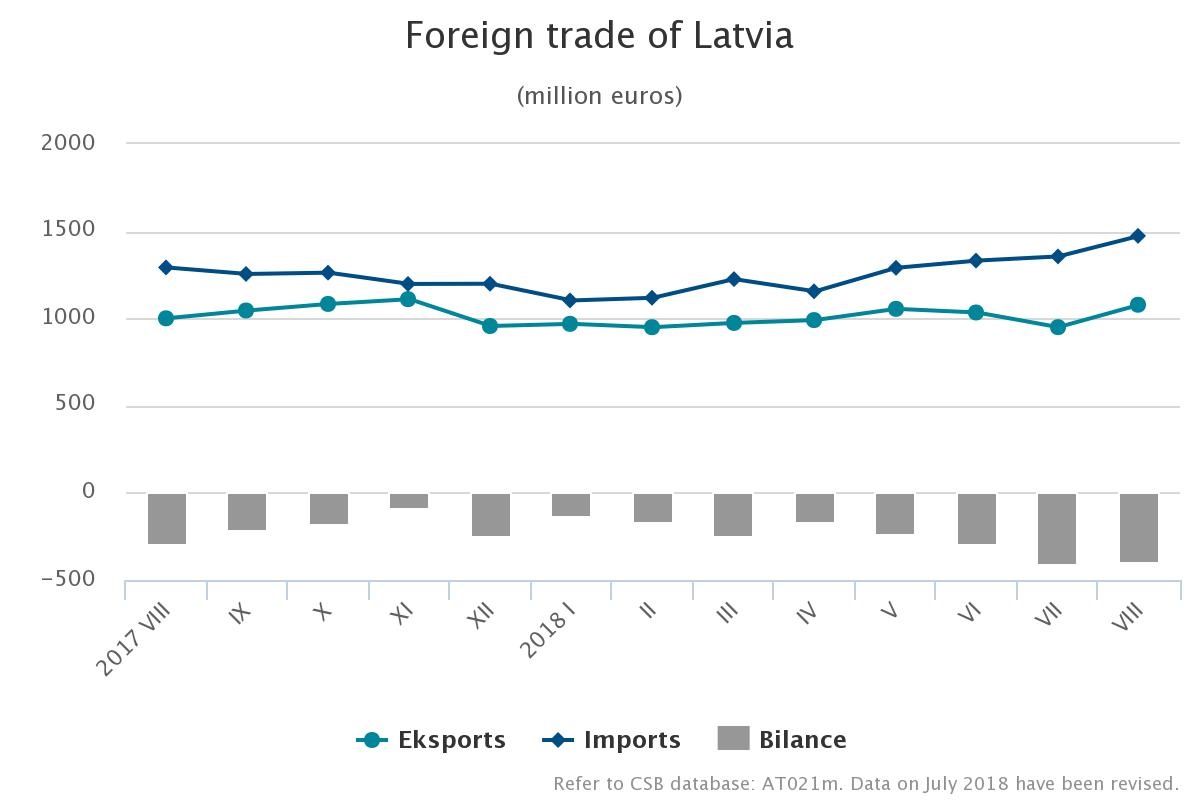
Over the first eight months of this year, the foreign trade turnover of
Latvia at current prices reached 18.05 bln euros – 1.61 bln euros
or 9.8% more than in the corresponding period of 2017. The exports value
constituted 8.0 bln euros (an increase of 687.6 mln euros or 9.4%),
whereas the imports value – 10.05 bln euros (an upturn of 924.4 mln euros
or 10.1%).
Calendar and seasonally adjusted data at current prices show that,
compared to August 2017, in August 2018 the exports value at current
prices went up by 8.0% and the imports value by 14.4%, whereas, compared to the
previous month, the exports value increased by 2.9% and the imports value by
1.8%.
Calendar and seasonally adjusted data at current prices show that, compared to August 2017, in August 2018 the exports value at current prices went up by 8.0% and the imports value by 14.4%, whereas, compared to the previous month, the exports value increased by 2.9% and the imports value by 1.8%.
Main changes in exports in
August 2018, compared to August 2017:
- exports of wood and articles of wood up by 48.2 mln euros or 30.9%,
- exports of vehicles and associated transport equipment up by 15.6 mln euros or 30.0%,
- exports of machinery and mechanical appliances; electrical equipment up by 12.8 mln euros or 6.6%,
- exports of basic metals and articles of basic metals up by 12.5 mln euros or 14.2%,
- exports of vegetable products down by 7.7 mln euros or 12.6%.
Main changes in imports in
August 2018, compared to August 2017:
- imports of mineral products up by 108.0 mln euros or 80.3%,
- imports of basic metals and articles of basic metals up by 23.8 mln euros or 25.9%,
- imports of wood and articles of wood up by 11.3 mln euros or 29.3%,
- imports of vehicles and associated transport equipment up by 10.3 mln euros or 7.2%,
- imports of prepared foodstuffs up by 6.5 mln euros or 5.2%.
In August, the main export partners
of Latvia in trade with EU countries were Lithuania (15.3% of total exports),
Estonia (11.9%), Sweden (8.0%) and Germany (7.2%), whereas the main import
partners were Lithuania (18.9% of total imports), Germany (8.6%), Poland (8.5%)
and Estonia (6.9%).
Russia was the main partner in trade with third countries; its share in total Latvian exports in August accounted for 9.4%, whereas in imports – for 12.3%.
Foreign
trade of Latvia by country group in August 2018,
(at current prices)
|
|
Exports |
Imports |
||||
|
|
mln euros |
% of total |
changes as%, compared to August 2017 |
mln euros |
% of total |
changes as%, compared to August 2017 |
|
Total |
1 078.3 |
100 |
7.8 |
1 473.3 |
100 |
14.0 |
|
European Union countries |
762.4 |
70.7 |
12.5 |
1 016.7 |
69.0 |
4.7 |
|
euro area countries |
504.0 |
46.7 |
10.1 |
746.2 |
50.6 |
3.0 |
|
CIS countries |
139.1 |
12.9 |
-2.8 |
226.7 |
15.4 |
76.6 |
|
other countries |
176.8 |
16.4 |
-1.6 |
229.9 |
15.6 |
19.4 |
Rise of exports of wood and wood products; wood charcoal in
August 2018, as compared to August 2017, was affected by the increase
in exports of round timber of 17.1 mln euros or 2.3 times. In turn,
exports of pharmaceutical products dropped as exports of medicaments decreased
by 5.0 mln euros or 17.0%.
Main
commodities in exports of Latvia in August 2018
(at current prices)
|
|
Thousand euros |
as% of total |
Changes
as%, compared to |
||
|
August 2017 |
July 2018 |
average of previous 12 months |
|||
|
Total |
1 078
347 |
100 |
7.8 |
13.5 |
6.8 |
|
wood and articles of wood; wood charcoal |
204 346 |
18.9 |
30.9 |
8.8 |
18.3 |
|
electrical machinery and equipment |
106 300 |
9.9 |
-0.9 |
11.6 |
5.0 |
|
machinery and mechanical appliances |
101 221 |
9.4 |
15.6 |
37.4 |
26.7 |
|
beverages, spirits and vinegar |
63 747 |
5.9 |
7.6 |
29.8 |
21.8 |
|
vehicles other than railway or tramway rolling
stock, and parts and accessories thereof |
54 368 |
5.0 |
7.8 |
-4.2 |
-5.0 |
|
iron and steel |
41 363 |
3.8 |
21.8 |
-6.5 |
3.8 |
|
mineral fuels, mineral oils and products of their
distillation |
40 929 |
3.8 |
-0.1 |
-2.3 |
-1.6 |
|
articles of iron and steel |
35 872 |
3.3 |
1.0 |
16.7 |
8.4 |
|
furniture, other furnishing articles;
prefabricated buildings |
31 477 |
2.9 |
-7.0 |
15.9 |
6.0 |
|
pharmaceutical products |
27 741 |
2.6 |
-13.6 |
-9.7 |
-22.6 |
Rise of imports of mineral fuels, mineral oils and products of their
distillation in August 2018, as compared to August 2017, was affected
by the increase in imports of natural gas of 66.5 mln euros or
2.5 times. In turn, decline in imports of passenger cars by 24.4 mln euros
or by 49.7% significantly influenced the total imports of vehicles other than
railway or tramway rolling stock, and parts and accessories thereof.
Main
commodities in imports of Latvia in August 2018
(at current prices)
|
|
Thousand euros |
as% of total |
Changes
as%, compared to |
||
|
August 2017 |
July 2018 |
average of previous 12 months |
|||
|
Total |
1 473
287 |
100 |
14.0 |
8.7 |
19.6 |
|
mineral fuels, mineral oils and products of their
distillation |
235 759 |
16.0 |
81.9 |
2.1 time |
2.3 times |
|
machinery and mechanical appliances |
147 006 |
10.0 |
-0.7 |
-20.9 |
-0.2 |
|
electrical machinery and equipment |
131 949 |
9.0 |
0.8 |
4.5 |
2.2 |
|
vehicles other than railway or tramway rolling
stock, and parts and accessories thereof |
77 516 |
5.3 |
-20.0 |
-26.9 |
-28.5 |
|
aircraft, spacecraft and parts thereof |
65 131 |
4.4 |
47.7 |
0.1 |
2.7 times |
|
beverages, spirits and vinegar |
65 076 |
4.4 |
5.1 |
-2.9 |
30.3 |
|
iron and steel |
56 416 |
3.8 |
53.1 |
11.0 |
13.7 |
|
plastics and articles thereof |
54 513 |
3.7 |
1.6 |
1.0 |
5.5 |
|
pharmaceutical products |
52 097 |
3.5 |
6.5 |
4.9 |
3.5 |
|
wood and articles of wood; wood charcoal |
49 648 |
3.4 |
29.5 |
3.4 |
13.3 |


 «The Baltic Course» Is Sold and Stays in Business!
