
Analytics, Export, Foreign trade , Lithuania, Statistics
International Internet Magazine. Baltic States news & analytics
Saturday, 20.04.2024, 12:07
Surplus on the services balance has increased in Lithuania
 Print version
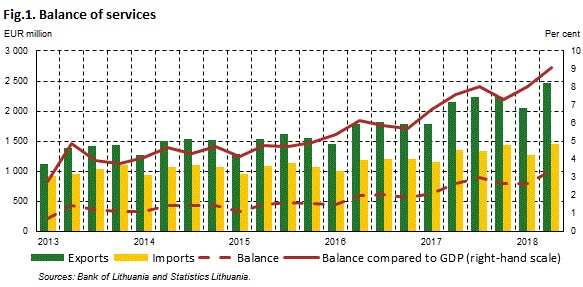
The surplus
of the balance of services amounted to EUR 1.0 bln, or 9.1% of GDP, and against
II quarter 2017, increased by 218.0 mln euros, or 27.5%. This stemmed
from exports of services which grew faster than imports – 15.1 and 7.8%
respectively.
Compared to
II quarter 2017, the fastest growth was recorded in exports of other
business services –28.5% (see the Table) and imports of financial services –
18.0%.
Transport
services comprised the bulk of exports and imports of services (57.9 and 51.9%
respectively). In II quarter 2018, the largest surplus (EUR 515.9 mln) was
recorded in the balance of road transport services, while the largest deficit
(EUR 43.1 mln) was on the balance of sea transport services.
Exports of
services to the EU countries accounted for 66.2% of total exports of services,
to CIS countries – 19.6%. Imports of services from the EU countries accounted
for 65.5% of total imports of services, from CIS countries – 20.1%.
In II
quarter 2018, against II quarter 2017, exports of services to the EU countries
grew by 16.6%, to CIS countries – 7.9%. Over the year, imports of services from
the EU countries grew by 8.9%, from the CIS countries – 8.5%.
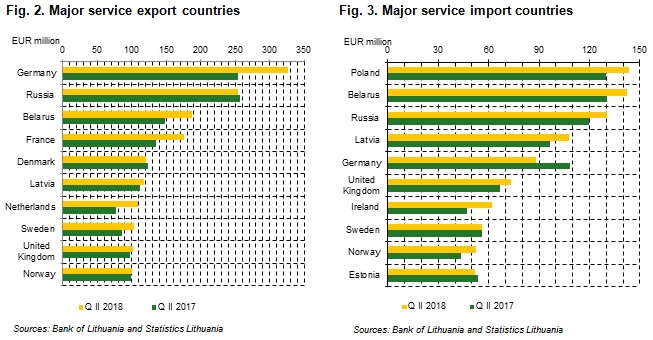
Germany was
Lithuania’s major partner in exports of services in II quarter 2018. Exports of
services to this country grew by 28.4% over the year. Exports of services to
Russia – second country in terms of export volumes – decreased by 1.1%. The
largest share of total exports of services to Germany and Russia was comprised
of transport services and travel services: to Germany – 71.0 and 10.8%
respectively, to Russia – 65.9 and 27.9% respectively.
The major partner in imports of services in the reference period was Poland. Over the year, imports of services from this country increased by 10.3%, from Belarus (second major partner) – by 9.2%. The largest share of imports of services from Poland consisted of transport services and travel services – 58.4 and 27.9% respectively, from Belarus – 73.7 and 21.2%
respectively.
Composition
of exports and imports of services, II quarter 2018
|
|
Exports |
Imports |
||||
|
EUR mln |
share, % |
Compared to II quarter 2017 % |
EUR mln |
share, % |
Compared to II quarter 2017 % |
|
|
Total services |
2474.8 |
100.0 |
15.1 |
1462.6 |
100.0 |
7.8 |
|
Technical
maintenance and repair services |
70.3 |
2.8 |
–3.5 |
35.3 |
2.4 |
4.1 |
|
Transport services |
1432.7 |
57.9 |
17.4 |
758.4 |
51.9 |
10.4 |
|
Passenger services |
68.3 |
2.8 |
6.5 |
45.7 |
3.1 |
–4.5 |
|
Freight services |
795.6 |
32.1 |
20.3 |
333.0 |
22.8 |
10.3 |
|
Other transport services |
568.8 |
23.0 |
15.0 |
379.7 |
26.0 |
12.5 |
|
Travel |
363.4 |
14.7 |
2.1 |
283.4 |
19.4 |
2.6 |
|
Construction |
72.0 |
2.9 |
2.2 |
17.0 |
1.2 |
–26.1 |
|
Financial services |
35.1 |
1.4 |
14.6 |
43.2 |
3 |
18.0 |
|
Telecommunications,
computer and information services |
128.8 |
5.2 |
5.8 |
74.8 |
5.1 |
4.4 |
|
Telecommunications services |
18.8 |
0.8 |
–34.5 |
19.9 |
1.3 |
–31.5 |
|
Computer services |
104.9 |
4.2 |
18.7 |
49.1 |
3.4 |
21.1 |
|
Information services |
5.1 |
0.2 |
8.9 |
5.8 |
0.4 |
2.8 times |
|
Other business services |
227.4 |
9.2 |
28.5 |
202.6 |
13.9 |
17.7 |
|
Research
and technological development services |
8.5 |
0.3 |
–5.8 |
1.2 |
0.1 |
–39.8 |
|
Professional
and advisory management services |
78.0 |
3.2 |
19.7 |
51.1 |
3.5 |
9.1 |
|
Technical,
trade-related and other business services |
140.9 |
5.7 |
37.2 |
150.3 |
10.3 |
21.8 |
|
Other undistributed services |
145.1 |
5.9 |
41.7 |
47.9 |
3.1 |
–14.6 |
Sources:
Bank of Lithuania and Statistics Lithuania.


 «The Baltic Course» Is Sold and Stays in Business!
