
Analytics, Foreign trade , Latvia, Statistics
International Internet Magazine. Baltic States news & analytics
Saturday, 20.04.2024, 03:22
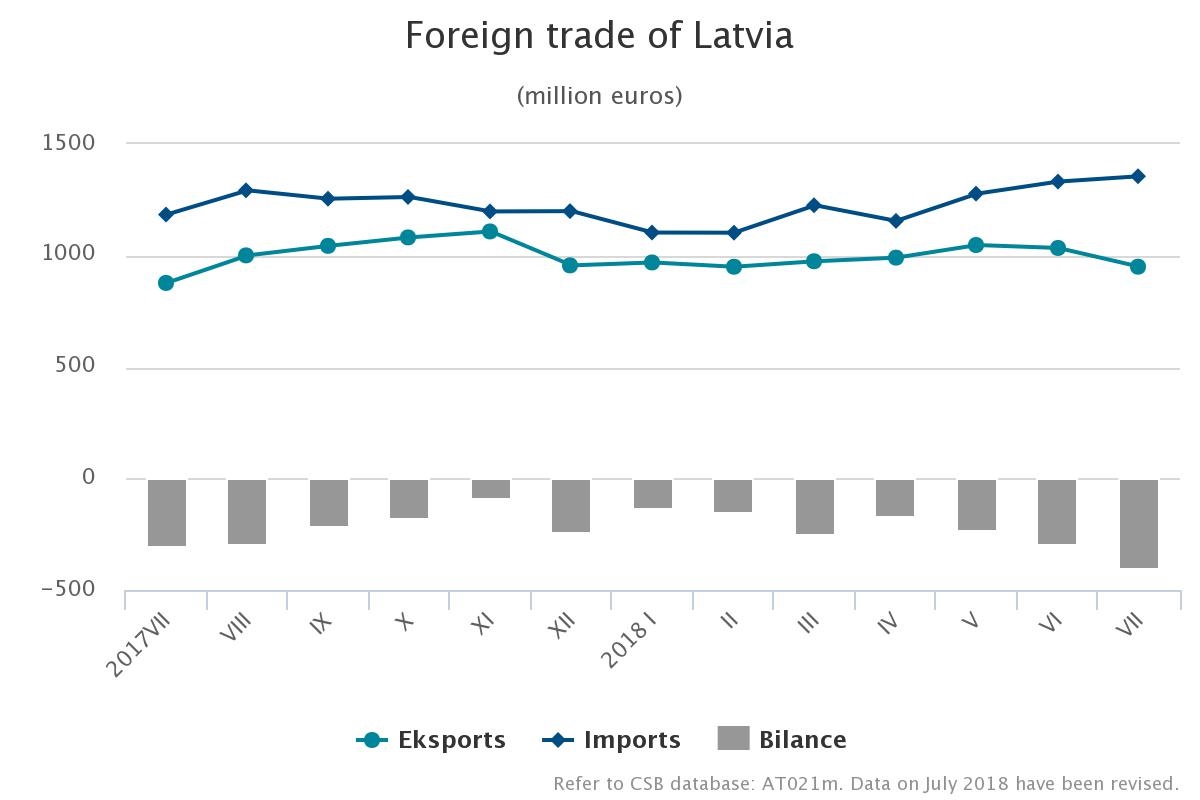
In July foreign trade turnover in goods was 11.9 % larger than last year in Latvia
 Print version
In July, Latvia exported goods in the amount of 949.8 mln euros but
imported – in the amount of 1.36 bln euros. Compared to July 2017,
foreign trade balance has worsened as exports in total foreign trade amount
decreased from 42.6% to 41.2%.
Calendar and seasonally adjusted data at current prices show that,
compared to July 2017, in July 2018 the exports value at current
prices went up by 8.2% and the imports value by 15.2%, whereas, compared to the
previous month, the exports value decreased by 0.01%, but the imports value
increased by 1.8%.
Main changes in exports in July 2018, compared to July 2017:
- exports of wood and articles of wood up by 41.5 mln euros or 28.3%,
- exports of basic metals and articles of basic metals up by 12.1 mln euros or 14.7%,
- exports of vehicles and associated transport equipment up by 10.4 mln euros or 21.2%,
- exports of prepared foodstuffs up by 8.5 mln euros or 10.0%,
- exports of optical instruments and apparatus (including medical); clocks and watches, musical instruments down by 5.0 mln euros or 24.4%.
Main changes in imports in July 2018, compared to July 2017:
- imports of machinery and mechanical appliances; electrical equipment up by 56.5 mln euros or 22.1%,
- imports of prepared foodstuffs up by 27.1 mln euros or 25.3%,
- imports of vegetable products up by 16.7 mln euros or 42.3%,
- imports of wood and articles of wood up by 12.4 mln euros or 34.8%,
- imports of textiles and textile articles down by 5.5 mln euros or 12.7%.
In July, the main export partners of Latvia in trade with EU countries
were Lithuania (18.0% of total exports), Estonia (11.4%), Germany (7.7%) and
United Kingdom (6.4%), whereas the main import partners were Lithuania (17.5%
of total imports), Germany (11.5%), Poland (8.8%) and Estonia (6.7%).
The main partner in trade with third countries was Russia, share of which
in total Latvian exports in July accounted for 9.3%, and in imports – for 5.3%.
Rise of exports of wood and wood products; wood charcoal in July 2018, as
compared to July 2017, was affected by the increase in exports of round timber
of 14.3 mln euros or 2.2 times. In turn, exports of pharmaceutical
products dropped as exports of medicaments decreased by 8.0 mln euros
or 23.3%.
The rise in the imports of machinery and mechanical appliances in
July 2018, as compared to July 2017, was facilitated by an increase
in the imports of turbojets, turbopropellers and other gas turbines by 40.5 mln
euros. In turn, rise in imports of wood and articles of wood was mainly
affected by growth in imports of sawn wood – of 3.8 mln euros or 33.7%.
Over the first seven months of this year, the foreign trade turnover of
Latvia at current prices reached 15.46 bln euros – 1.32 bln
euros or 9.3% more than in the corresponding period of 2017. The exports value
constituted 6.91 bln euros (an increase of 601.9 mln euros or 9.5%),
whereas the imports value – 8.55 bln euros (an upturn
of 714.2 mln euros or 9.1%).
Foreign
trade of Latvia by country group in July 2018
(at current prices)
|
|
Exports |
Imports |
||||
|
|
million EUR |
% of total |
changes
as %, compared to July 2017 |
million EUR |
% of total |
changes
as %, compared to July 2017 |
|
Total |
949.8 |
100 |
8.3 |
1 355.4 |
100 |
14.5 |
|
European
Union countries |
692.7 |
72.9 |
13.3 |
996.6 |
73.5 |
10.0 |
|
euro area
countries |
475.6 |
50.1 |
15.1 |
740.5 |
54.6 |
8.9 |
|
CIS
countries |
121.5 |
12.8 |
-6.0 |
120.1 |
8.9 |
-4.8 |
|
other
countries |
135.6 |
14.3 |
-0.5 |
238.7 |
17.6 |
57.7 |
Main
commodities in exports of Latvia in July 2018
(at current prices)
|
|
Thousand EUR |
As %
of total |
Changes
as %, compared to |
||
|
July 2017 |
June 2018 |
average
of previous 12 months |
|||
|
Total |
949 754 |
100 |
8.3 |
-8.1 |
-5.3 |
|
wood and
articles of wood; wood charcoal |
187 745 |
19.8 |
28.4 |
-0.5 |
11.3 |
|
electrical
machinery and equipment |
95 289 |
10.0 |
-9.8 |
0.4 |
-7.1 |
|
machinery
and mechanical appliances |
73 681 |
7.8 |
24.2 |
-23.4 |
-6.3 |
|
vehicles
other than railway or tramway rolling stock, and parts and accessories
thereof |
56 751 |
6.0 |
24.1 |
3.1 |
1.6 |
|
beverages,
spirits and vinegar |
49 130 |
5.2 |
2.7 |
11.7 |
-6.1 |
|
iron and
steel |
44 220 |
4.7 |
18.4 |
1.1 |
12.7 |
|
mineral
fuels, mineral oils and products of their distillation |
41 891 |
4.4 |
18.1 |
1.0 |
1.6 |
|
articles
of iron and steel |
30 734 |
3.2 |
9.6 |
-12.0 |
-6.3 |
|
pharmaceutical
products |
30 711 |
3.2 |
-18.6 |
-27.0 |
-14.9 |
|
furniture,
other furnishing articles; prefabricated buildings |
27 151 |
2.9 |
-10.2 |
-4.5 |
-9.4 |
Main
commodities in imports of Latvia in July 2018
(at current prices)
|
|
Thousand EUR |
As %
of total |
Changes
as %, compared to |
||
|
July 2017 |
June 2018 |
average
of previous 12 months |
|||
|
Total |
1 355
422 |
100 |
14.5 |
1.8 |
11.5 |
|
machinery
and mechanical appliances |
185 862 |
13.7 |
43.0 |
-4.0 |
30.3 |
|
electrical
machinery and equipment |
126 290 |
9.3 |
0.5 |
8.6 |
-2.2 |
|
mineral
fuels, mineral oils and products of their distillation |
109 713 |
8.1 |
7.4 |
12.3 |
7.8 |
|
vehicles
other than railway or tramway rolling stock, and parts and accessories
thereof |
106 097 |
7.8 |
8.4 |
-6.9 |
0.2 |
|
beverages,
spirits and vinegar |
66 995 |
4.9 |
30.2 |
16.7 |
36.8 |
|
plastics
and articles thereof |
53 959 |
4.0 |
2.3 |
-6.7 |
4.8 |
|
iron and
steel |
50 833 |
3.8 |
7.1 |
0.5 |
3.1 |
|
pharmaceutical
products |
49 672 |
3.7 |
13.8 |
-16.7 |
-1.0 |
|
wood and
articles of wood; wood charcoal |
48 034 |
3.5 |
35.1 |
-8.5 |
12.1 |
|
articles
of iron and steel |
32 070 |
2.4 |
9.0 |
-6.9 |
8.3 |


 «The Baltic Course» Is Sold and Stays in Business!
