
Analytics, Inflation, Lithuania, Markets and Companies
International Internet Magazine. Baltic States news & analytics
Friday, 26.04.2024, 01:09
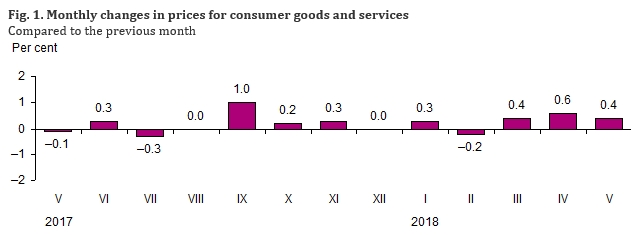
In May, annual inflation in Lithuania stood at 2.9%
 Print version
Over the said period, prices for consumer goods increased by 0.5, those for consumer services – by 0.2%. The influence of the change in prices for consumer goods on the overall monthly price change stood at plus 0.349 percentage points, that of the change in prices for consumer services – at plus 0.048 percentage points.
Prices for consumer goods and services regulated by State and municipal authorities decreased by 1.3%, while market prices – increased by 0.7%. The influence of the change in prices regulated by State and municipal authorities stood at minus 0.173 percentage points, the influence of the change in market prices – at plus 0.569 percentage points.
|
Categories of
goods and services |
Price growth,% |
Categories of
goods and services |
Price drop (–),% |
|
Fresh fruit and vegetables |
|||
|
Melons |
24.3 |
Bananas |
–18.7 |
|
Carrots |
22.6 |
Early white cabbage |
–17.4 |
|
Head lettuce |
22.1 |
Short cucumbers |
–14.9 |
|
Sweet pepper |
19.0 |
Avocados |
–10.2 |
|
Chinese cabbage |
15.6 |
Grapes |
–9.1 |
|
Lemon |
10.0 |
Spinach |
–7.2 |
|
Grapefruit |
7.8 |
Oranges |
–6.2 |
|
Early potatoes |
7.8 |
Leaf lettuce |
–5.4 |
|
Beetroot |
5.6 |
Tomatoes |
–5.1 |
|
Food products and non-alcoholic beverages (excl.
fresh fruit and vegetables) |
|||
|
Coffee |
3.5 |
Eggs |
–5.2 |
|
Oil |
2.6 |
Ice-cream |
–3.9 |
|
Fresh or chilled seafood |
2.4 |
Edible offal |
–3.2 |
|
Baby food |
2.0 |
Chocolate |
–3.0 |
|
Smoked sausages |
1.7 |
Rice |
–2.5 |
|
Dough products with meat |
1.7 |
Sugar |
–2.0 |
|
Salted fish |
1.6 |
Cereal flakes |
–2.0 |
|
Crisps |
1.2 |
Pizzas and quiches |
–1.9 |
|
Confectionery |
1.2 |
Preserved milks |
–1.4 |
|
Tea |
1.1 |
Cheese |
–0.8 |
|
Alcoholic beverages and tobacco products |
|||
|
Wine and wine products |
0.9 |
Spirits |
–1.6 |
|
Tobacco products |
0.1 |
Beer |
–0.3 |
|
Non-food products |
|||
|
Footwear |
4.4 |
Baby products |
–2.5 |
|
Sports equipment |
3.8 |
House and
garden tools and equipment |
–1.7 |
|
Pet products |
3.0 |
Household
cleaning and maintenance products |
–1.6 |
|
Flowers |
1.8 |
Equipment for
the reception, recording and reproduction of sound and pictures |
–1.3 |
|
Personal hygiene products |
1.6 |
Lighting equipment |
–0.9 |
|
Products and
materials for the maintenance and repair of the dwelling |
1.4 |
Accessories
for personal transport equipment |
–0.8 |
|
Pharmaceuticals |
1.0 |
Telephone equipment |
–0.7 |
|
Clothing |
0.7 |
|
|
|
Energy goods |
|||
|
Petrol |
7.0 |
Heat energy |
–6.2 |
|
Diesel fuel |
6.8 |
|
|
|
Liquefied gas for cars |
5.3 |
|
|
|
Liquid fuel |
4.0 |
|
|
|
Liquefied gas for cooking |
0.4 |
|
|
|
Solid fuel |
0.2 |
|
|
|
Services |
|||
|
Hotels |
12.6 |
Waste collection |
–11.4 |
|
Sanatoriums |
4.5 |
Funeral services |
–1.1 |
|
Repair of furniture |
3.1 |
Transport insurance |
–1.0 |
|
Passenger transport by air |
2.7 |
Package holidays |
–0.8 |
|
Maintenance
and repair of personal transport equipment |
2.4 |
Recreation and sport |
–0.7 |
|
Holiday houses |
2.2 |
|
|
|
Services of photographers |
1.5 |
|
|
|
Maintenance
and repair of dwelling |
1.1 |
|
|
|
Catering |
0.5 |
|
|
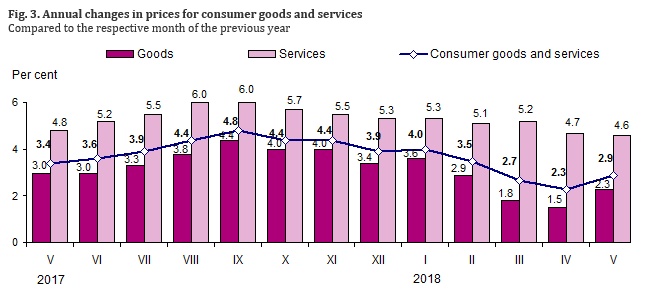
In May 2018, annual (May 2018, against May 2017) inflation stood at 2.9%.
Annual inflation was mainly influenced by an increase in prices for fuels and lubricants, solid fuel, milk and milk products, cheese and eggs, services of restaurants, cafés and the like, tobacco products, oil and fats, as well as by a decrease in prices for spirits, pharmaceuticals, wine and wine products, sugar, chocolate and confectionery, fruit (see Table 3).
Over the year, prices for consumer goods and services increased by 2.3 and 4.6% respectively. In May 2018, against May 2017, prices regulated by State and municipal authorities increased by 0.2, market prices – 3.3%.
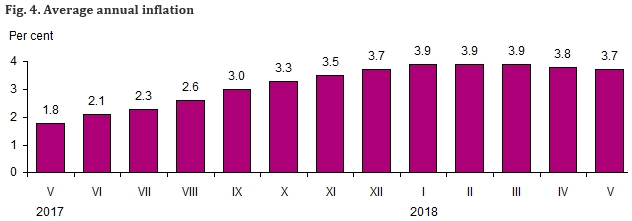
In May 2018, average annual inflation rate stood at 3.7%.
Table 2. Changes in prices for consumer goods and services, May 2018
|
COICOP divisions of
consumer goods and services |
Relative share (weight) of
consumption expenditure in total consumption expenditure |
Price growth, drop (–) |
|||
|
May 2018, against |
Average annual |
||||
|
April 2018 |
2017 |
||||
|
December |
May |
||||
|
Consumer goods and services |
100.0 |
0.4 |
1.6 |
2.9 |
3.7 |
|
Food products and non-alcoholic beverages |
21.97 |
–0.4 |
0.4 |
2.6 |
3.4 |
|
Alcoholic beverages and tobacco products |
8.92 |
–0.4 |
2.1 |
0.0 |
8.9 |
|
Clothing and footwear |
7.35 |
1.8 |
0.4 |
0.8 |
1.2 |
|
Housing, water, electricity, gas and other fuels |
11.66 |
–1.5 |
1.1 |
4.0 |
3.8 |
|
Furnishings, household equipment and routine
maintenance of the house |
5.34 |
–0.5 |
1.3 |
0.5 |
0.8 |
|
Health care |
6.66 |
0.7 |
1.1 |
1.4 |
0.9 |
|
Transport |
13.66 |
3.5 |
3.9 |
6.7 |
3.6 |
|
Communications |
3.29 |
–0.1 |
–1.0 |
–1.6 |
0.1 |
|
Recreation and culture |
7.14 |
0.1 |
1.5 |
3.6 |
4.1 |
|
Education |
1.78 |
0.4 |
1.2 |
3.1 |
2.5 |
|
Hotels, cafés and restaurants |
5.37 |
0.9 |
2.9 |
6.1 |
7.4 |
|
Miscellaneous goods and services |
6.86 |
0.2 |
2.6 |
3.4 |
4.4 |
|
Consumer goods |
72.76 |
0.5 |
1.5 |
2.3 |
3.1 |
|
Consumer services |
27.24 |
0.2 |
1.8 |
4.6 |
5.3 |
Table 3. Largest
influence on the overall change in consumer prices over the month by COICOP
class of consumer goods and services
|
COICOP classes of consumer goods and services |
Relative share (weight) of consumption expenditure
in total consumption expenditure, % |
Price growth, drop (–), % |
Influence, percentage points |
|
May 2018, against April |
|||
|
Fuels and lubricants |
6.3 |
6.7 |
+0.422 |
|
Footwear |
2.1 |
4.4 |
+0.091 |
|
Maintenance
and repair of personal transport equipment |
1.9 |
2.4 |
+0.045 |
|
Pharmaceuticals |
3.3 |
1.0 |
+0.034 |
|
Clothing |
4.9 |
0.7 |
+0.033 |
|
Coffee, tea and cocoa |
1.0 |
2.9 |
+0.028 |
|
Non-durable household goods |
1.6 |
–1.6 |
–0.026 |
|
Milk and milk
products, cheese and eggs |
4.2 |
–0.7 |
–0.030 |
|
Spirits |
2.5 |
–1.6 |
–0.042 |
|
Fruit |
1.3 |
–5.4 |
–0.070 |
|
Waste collection |
0.6 |
–11.4 |
–0.077 |
|
Heat energy |
2.2 |
–6.2 |
–0.136 |
|
May 2018, against May 2017 |
|||
|
Fuels and lubricants |
6.3 |
10.0 |
+0.624 |
|
Solid fuel |
1.7 |
19.7 |
+0.332 |
|
Milk and milk
products, cheese and eggs |
4.2 |
6.3 |
+0.254 |
|
Services of
restaurants, cafés and the like |
3.8 |
6.1 |
+0.217 |
|
Tobacco products |
2.5 |
8.8 |
+0.213 |
|
Oil and fats |
1.3 |
15.6 |
+0.181 |
|
Sewerage collection services |
0.6 |
–6.6 |
–0.040 |
|
Fruit |
1.3 |
–3.7 |
–0.052 |
|
Sugar, jam,
honey, chocolate and confectionery |
1.5 |
–4.2 |
–0.066 |
|
Wine and wine products |
1.6 |
–3.8 |
–0.075 |
|
Pharmaceuticals |
3.3 |
–2.4 |
–0.085 |
|
Spirits |
2.5 |
–4.6 |
–0.170 |
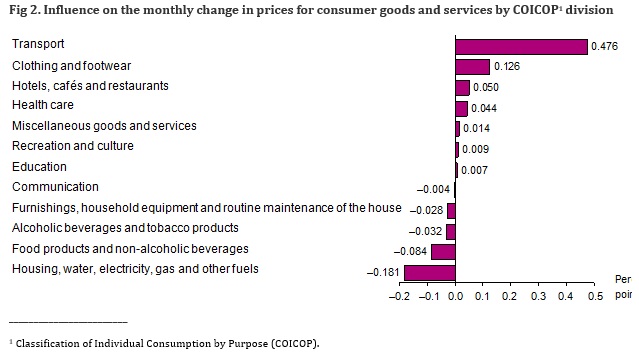
The overall change in consumer prices is influenced not only by the size of the price change for a certain product but also by the relative share (weight) of expenditure on that product in the total consumption expenditure.
More information on the issue is available in the Database of Indicators.


 «The Baltic Course» Is Sold and Stays in Business!
