Airport, Analytics, Latvia, Port, Tourism, Transport
International Internet Magazine. Baltic States news & analytics
Thursday, 25.04.2024, 07:28
In Q1, the volume of freights carried was reducing in Latvia
 Print version
Drop in rail freights and increase in road freights
The volume of freights carried by rail reduced by 2.2 million tonnes or 15.4%, whereas the freight turnover – by 10.5%. The volume of freights carried by road increased by 0.4 million tonnes or 3%, whereas the freight turnover – fell by 5.4%. The volume of oil products transported via the main oil products pipeline and freight turnover dropped by 38.5%.

Freight traffic and freight turnover of land and pipeline transport during the 1st quarter of 2018
|
|
Freights
carried, million tonnes |
Freight turnover, million tkm |
||||
|
|
1st quarter of 2017 |
1st quarter of 2018 |
changes as %, compared to the 1st quarter of 2017 |
1st quarter of 2017 |
1st quarter of 2018 |
changes as %, compared to the 1st quarter of 2017 |
|
Total |
30.0 |
27.7 |
-7.7 |
9 344.6 |
8 377.3 |
-10.4 |
|
rail transport |
14.1 |
11.9 |
-15.4 |
4 953.2 |
4 431.2 |
-10.5 |
|
road transport |
14.4 |
14.9 |
3.0 |
3 760.4 |
3 558.1 |
-5.4 |
|
pipeline transport |
1.5 |
0.9 |
-38.5 |
631.0 |
388.0 |
-38.5 |
A drop remains in freight turnover at ports
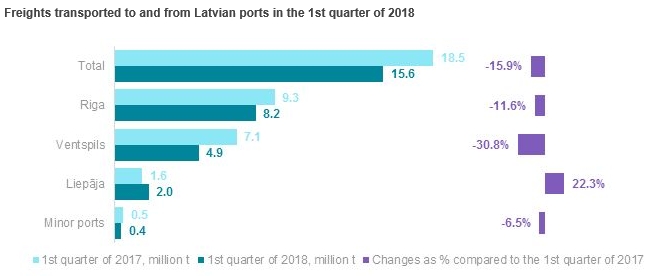
In the 1st quarter of 2018, freights transported to and from Latvian ports accounted for 15.6 million tonnes, which is 15.9% less than in the 1st quarter of 2017.
13.5 million tons of freights were shipped from ports, which is 20.3% less than during the 1st quarter of 2017. The decrease in the volume of freights shipped was facilitated by the fall of 1.6 million tonnes or 26.9% in the volume of coal loaded onto ships, as well as decrease of 2 million tonnes or 36.9% in the volume of oil products. Rise in the volume of shipped freights was recorded in the freights of grain and grain products (45.2%) and timber (31.9%). Also, the volume of loaded freights in containers and roll on/ roll off increased by 4.6% and 17.8%, respectively.
The volume of freights received at ports rose by 33.2%. Rise in the volume of unloaded goods in containers and roll on/roll off comprised 3.3% and 20.5%, respectively, but increase in oil products unloaded – 47%.
Riga International Airport received and shipped 6.2 thousand tonnes of cargo, which was 33% more than in in the 1st quarter of 2017.

Upturn in passenger number at ports and airport, downturn in number of passengers carried by land
During the 1st quarter of 2018, the number of passengers carried by land passenger transport comprised 57.9 million passengers, less by 4.9% than in the 1st quarter of 2017.
The number of passengers carried by rail remained at the level of the previous year (increase of 0.2%), but the number of passengers carried by regular bus traffic lines and urban electric transport fell by 7.3% and 1.7%, respectively.
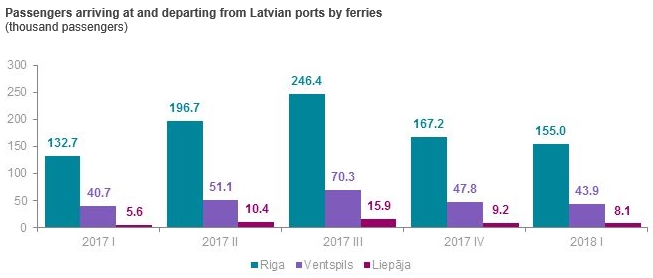
The number of passengers arrived at and departed from Latvian ports with ferries accounted for 207 thousand, which is 15.7% more than in the 1st quarter of 2017.
There were 3.3 thousand passengers who arrived at the Riga Passenger Terminal via cruise ships – 84.7% more than in the same period of time of the previous year.
The number of passengers arrived at and departed from the Riga International Airport constituted 1.4 million, which is 19.4% more than in 1st quarter of the previous year.
Methodological explanations
1Freight turnover of land and pipeline transport is calculated in tonne-kilometres by summing up the products of the weight (tonnes) of each batch of freight transported and its transportation distance (kilometres). Tonne-kilometre (tkm) – unit of measure of freight transport, which represents the transport of one tonne of goods over a distance of one kilometre.
More information on transport statistics in Latvia is available in the Transport – Key Indicators section of the CSB website. The latest transport data are published in the "Transport and Tourism" section of the CSB database (short-term statistical data and annual statistical data).


 «The Baltic Course» Is Sold and Stays in Business!

